We’ve significantly upgraded our artist audience data — giving you one of the most precise views of fanbases on the market.
What’s improved?
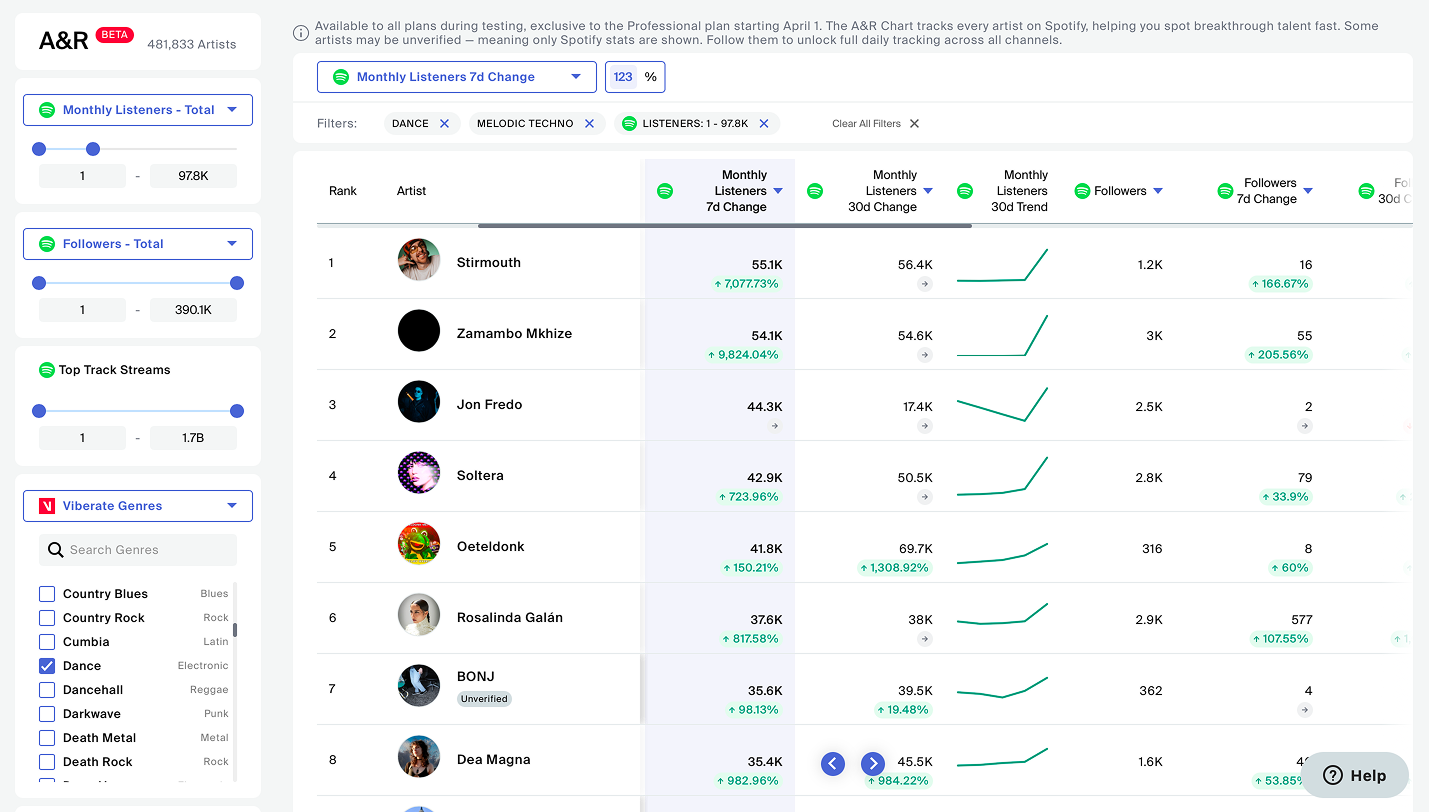
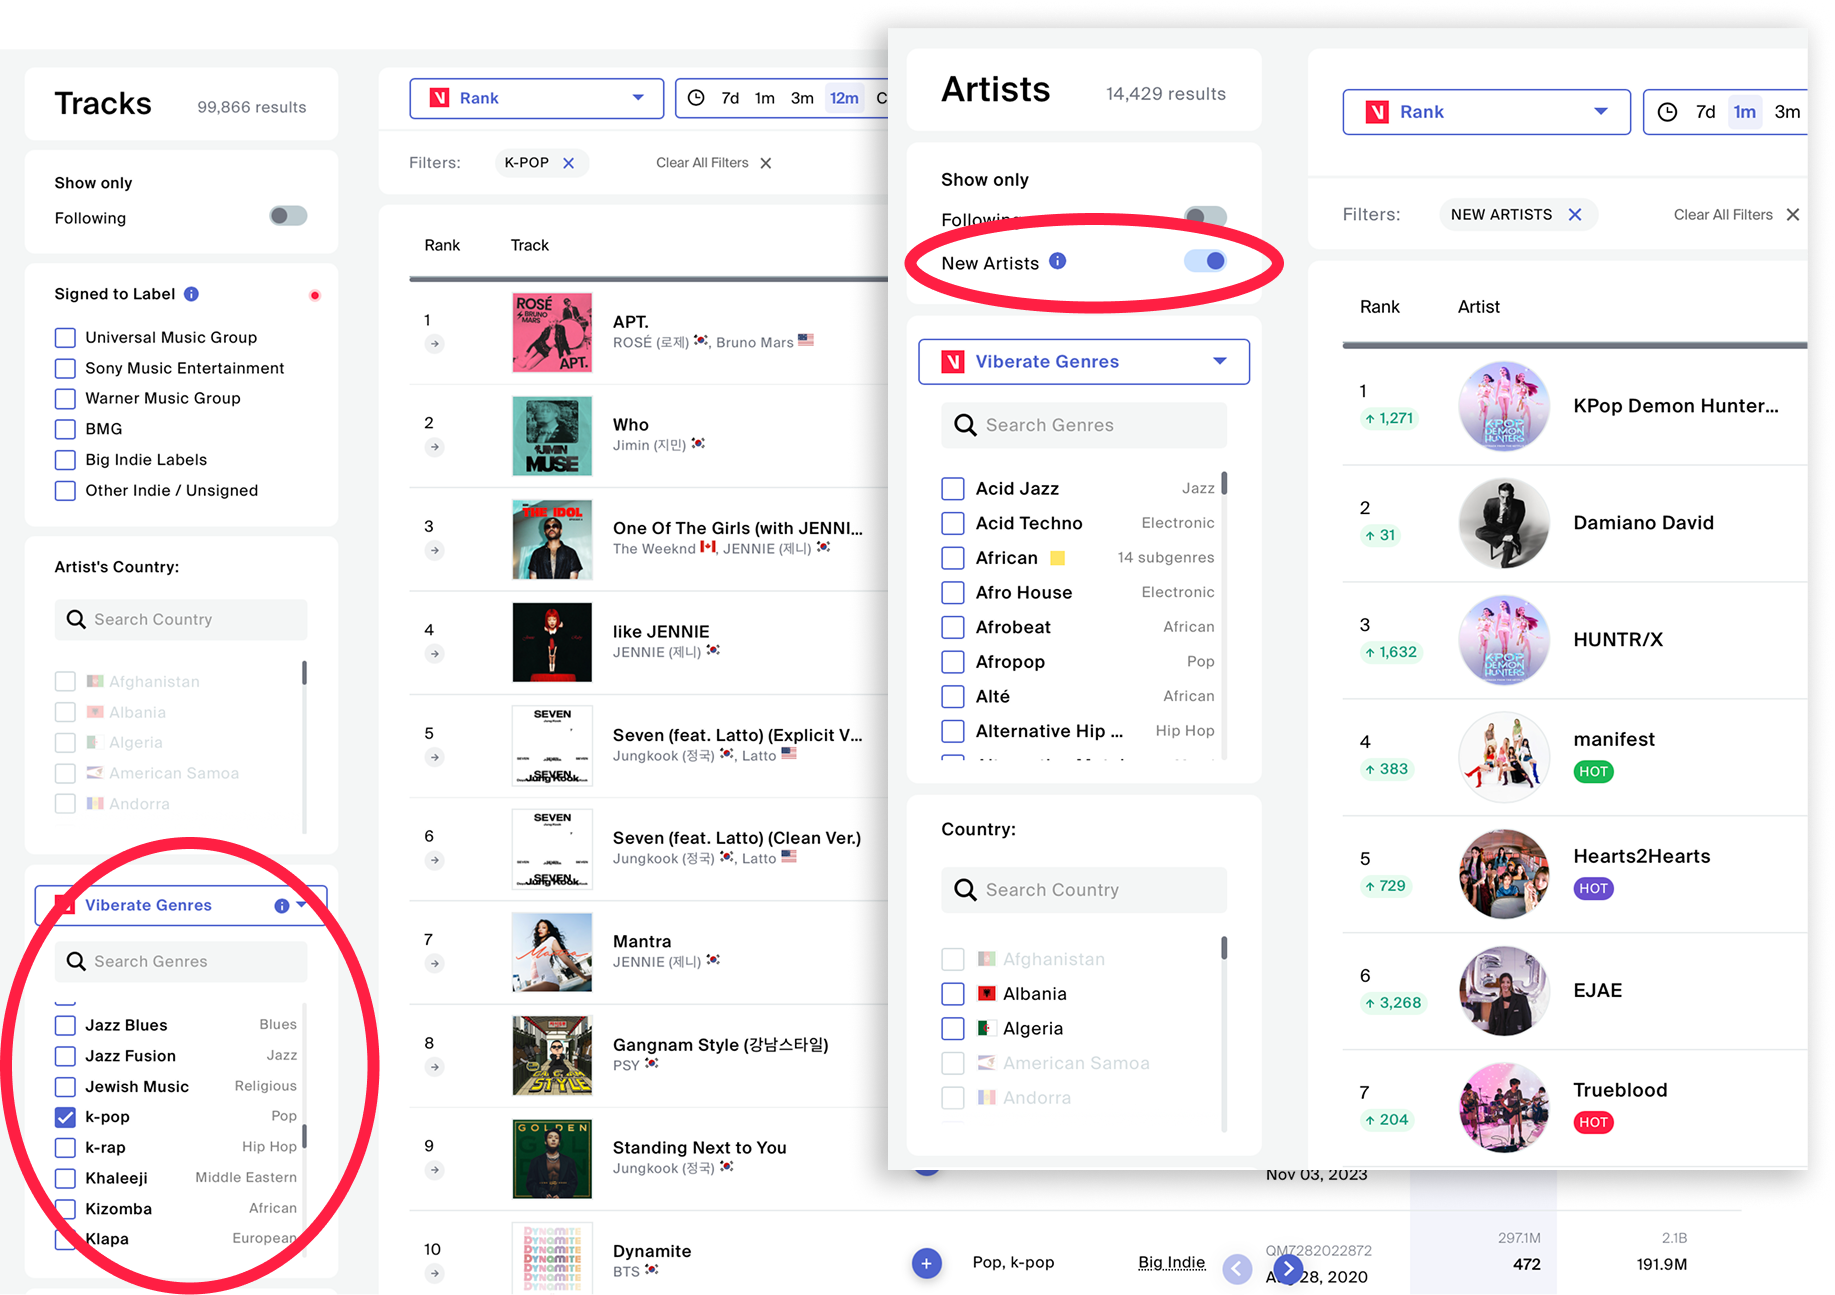
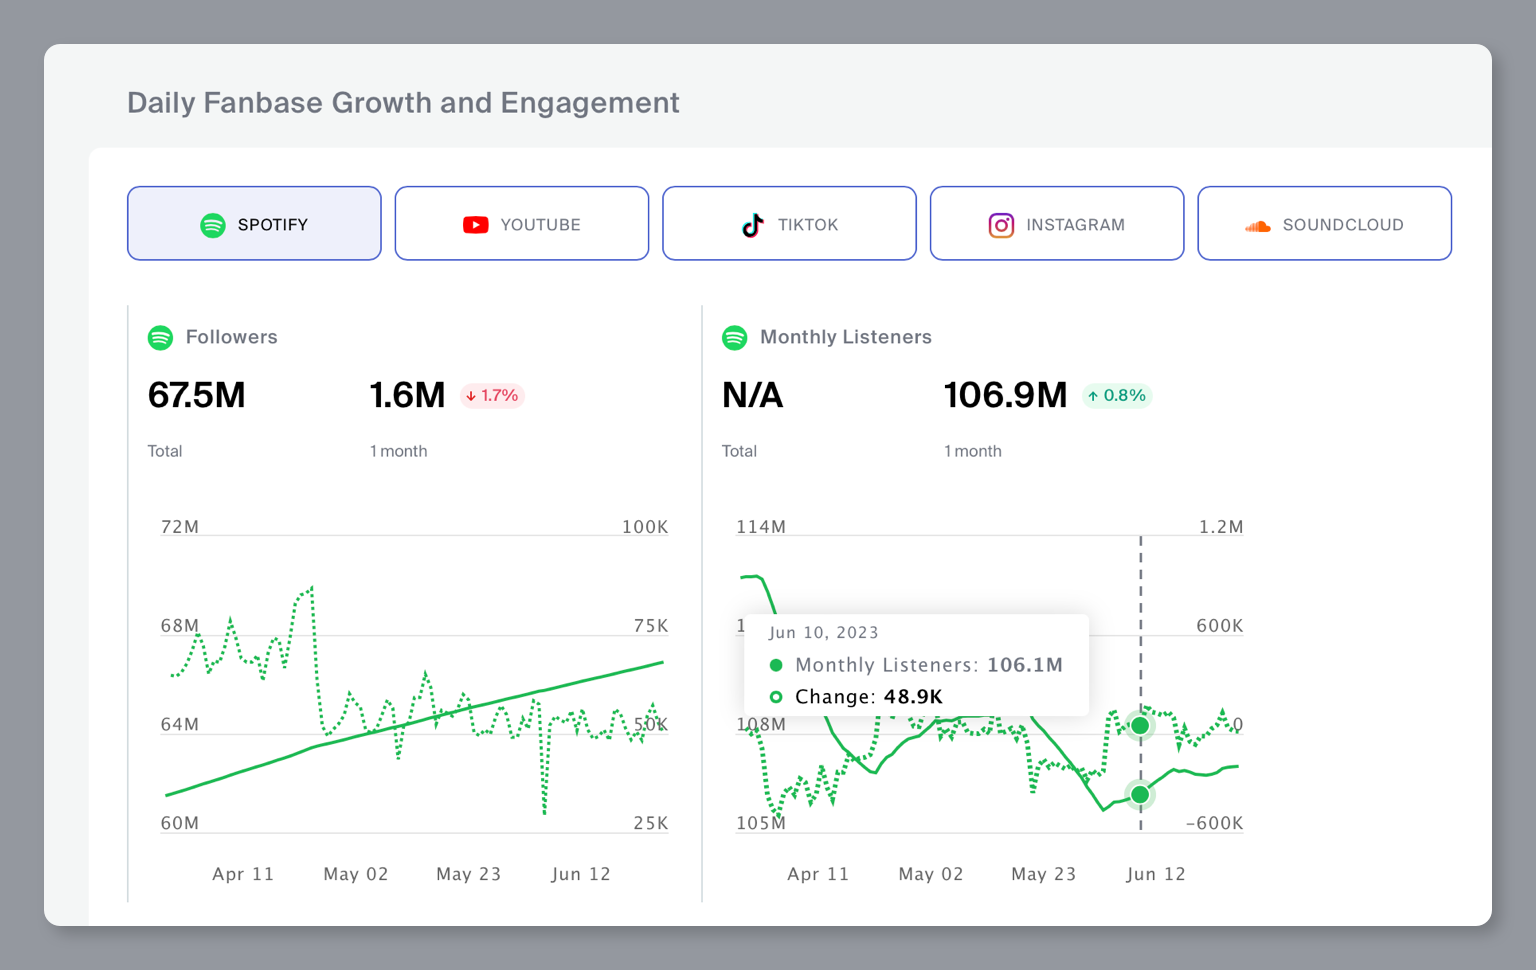
✅ Audience data now available for every artist on Spotify
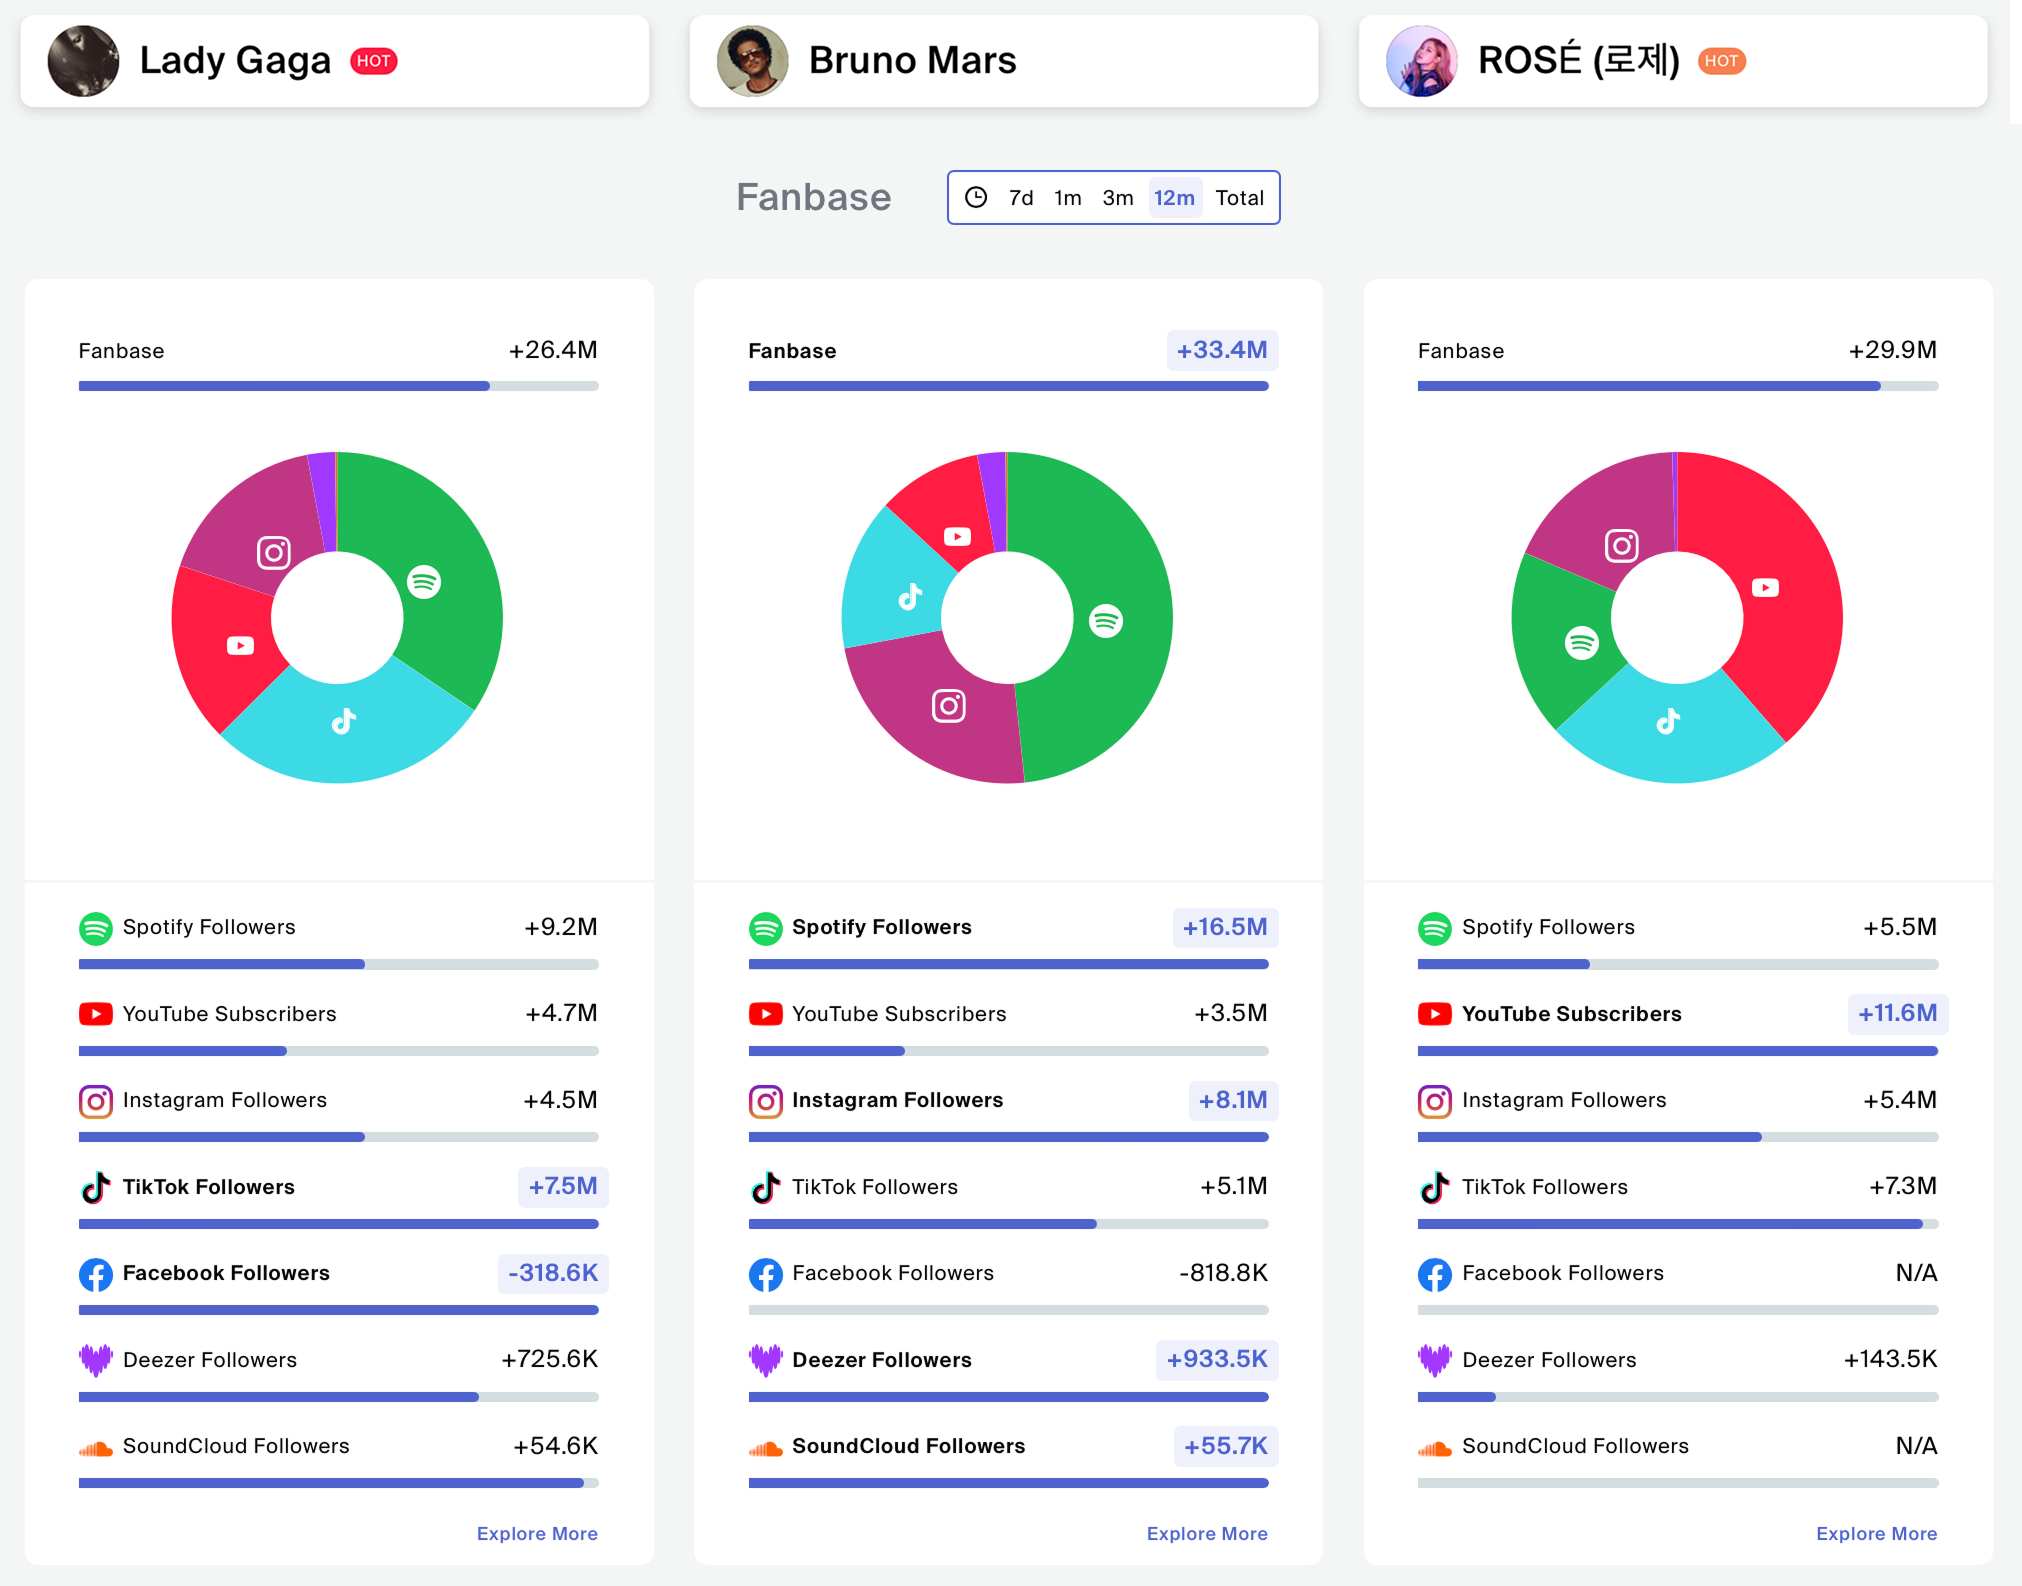
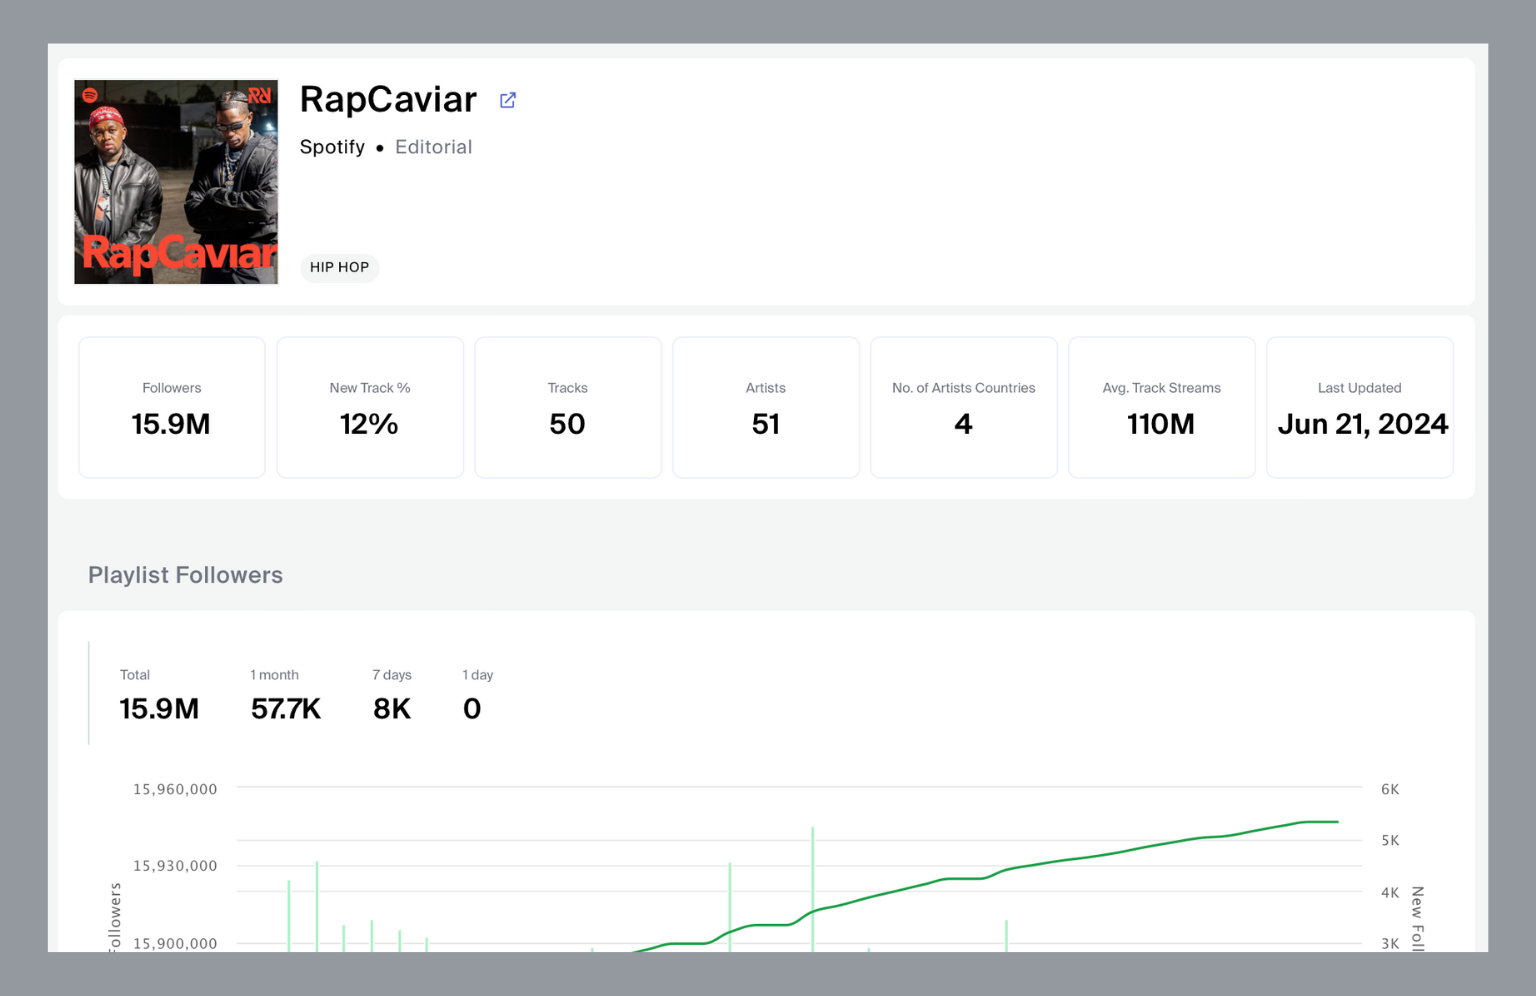
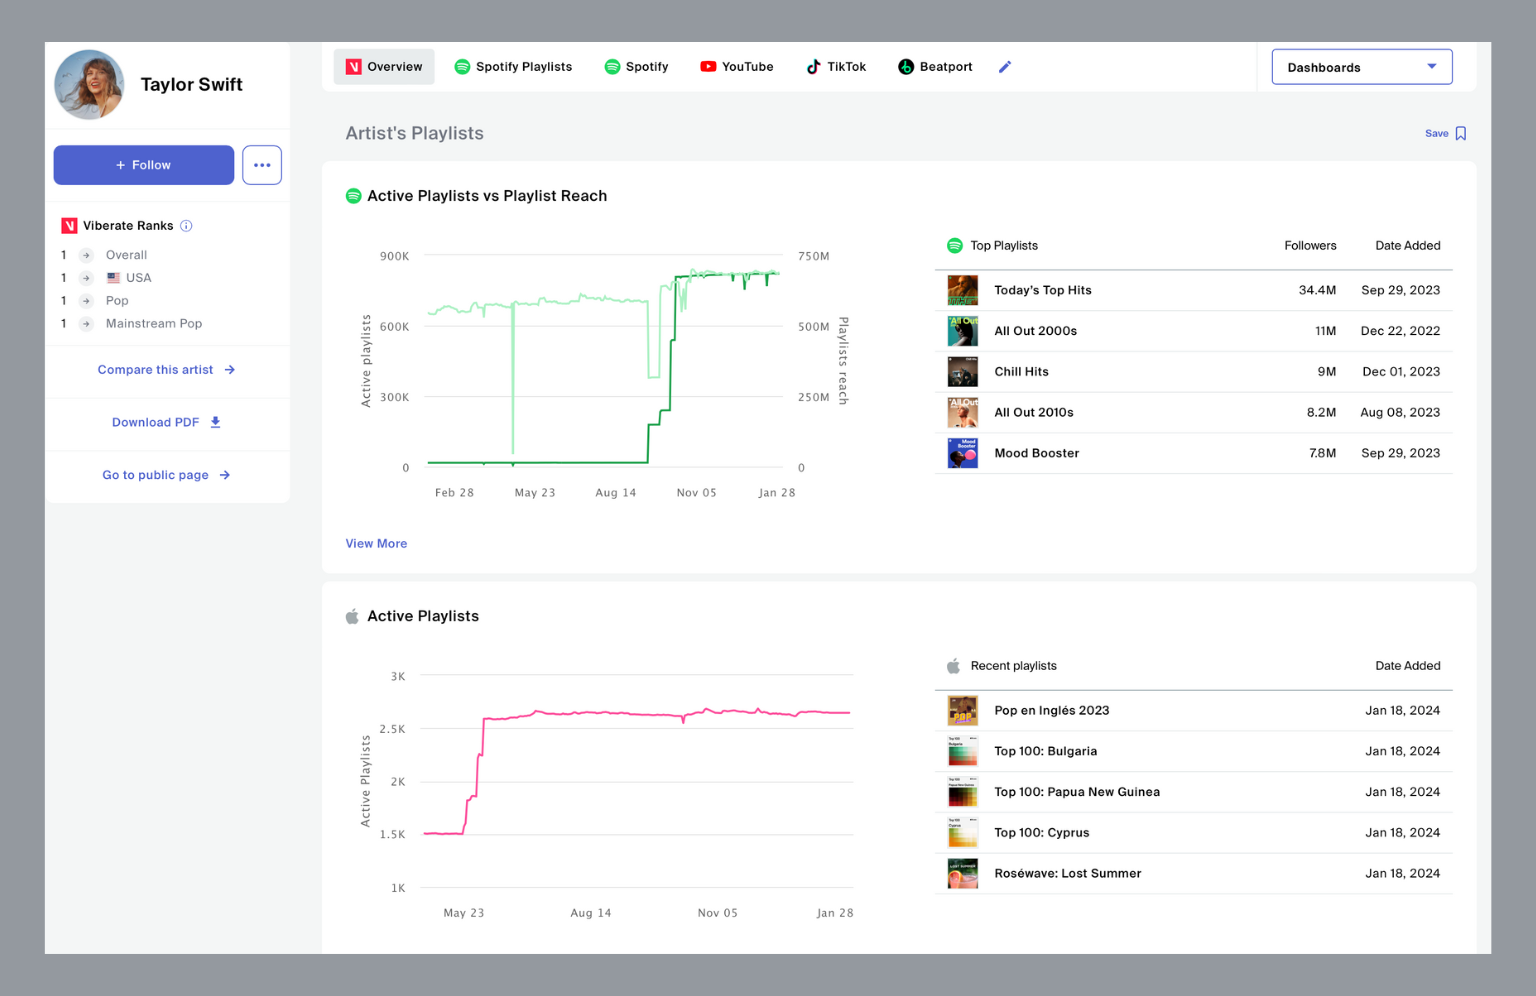
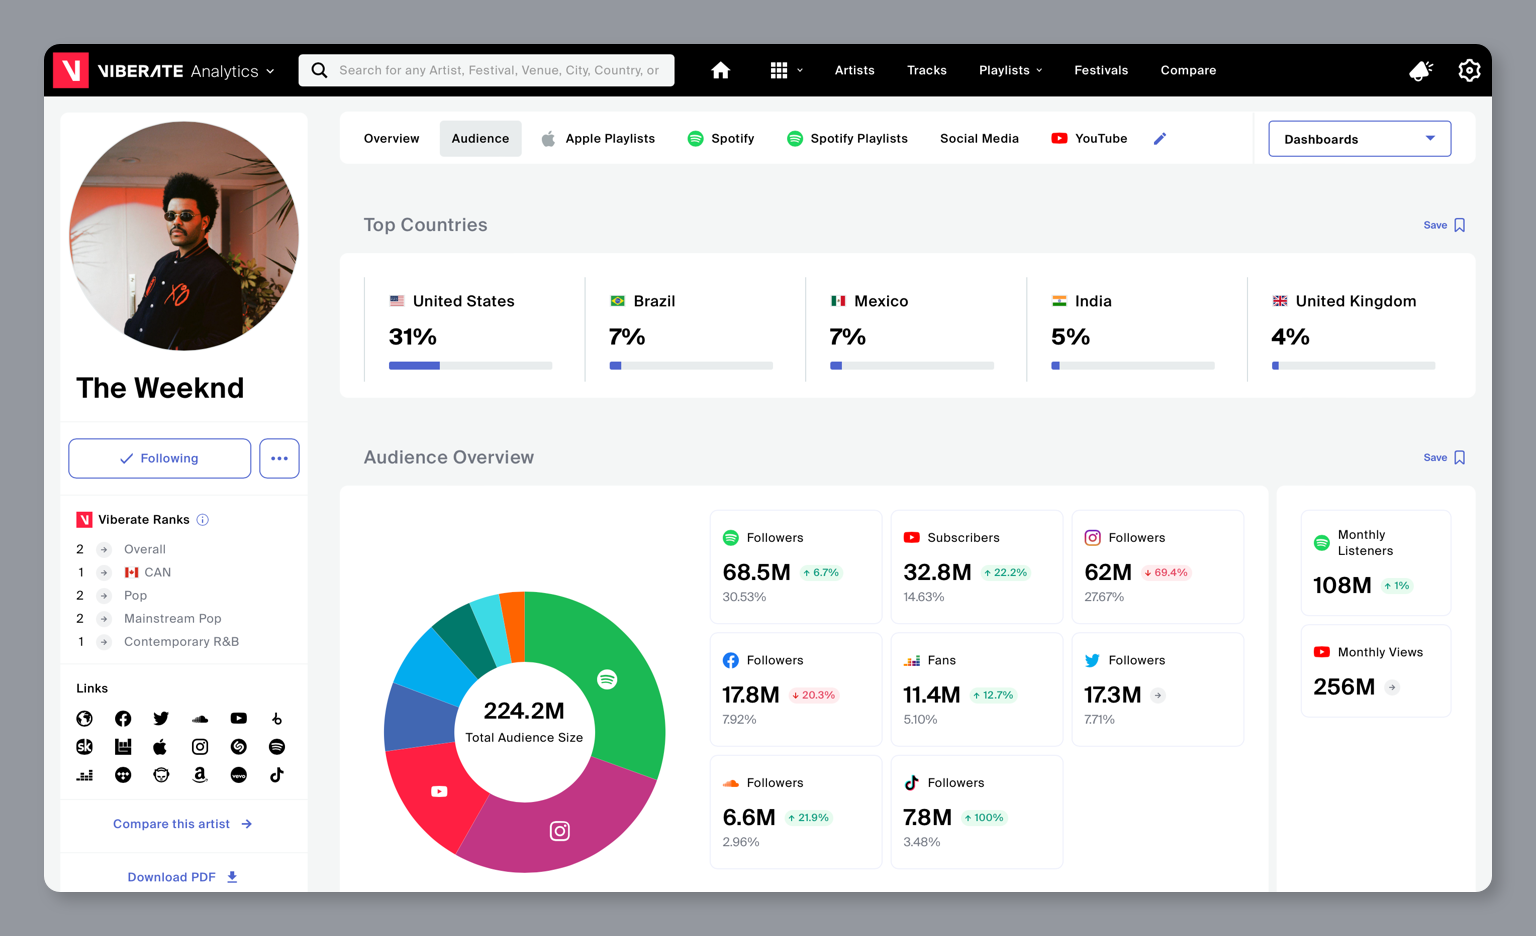
✅ A major upgrade to Spotify and YouTube audience data, delivering more precise fanbase insights
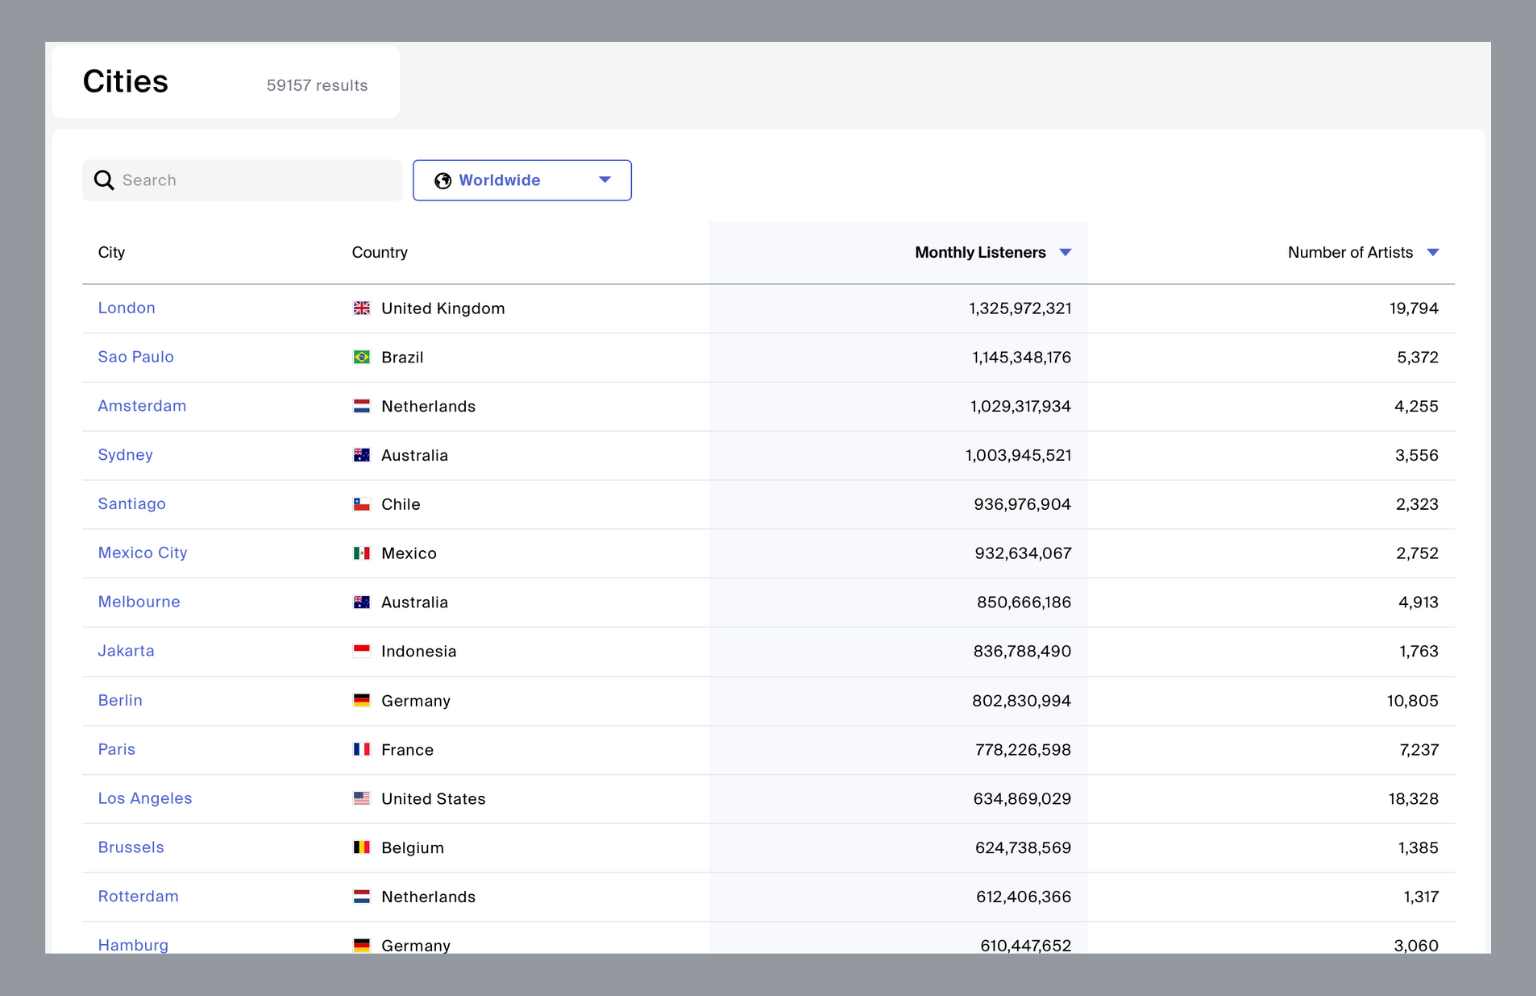
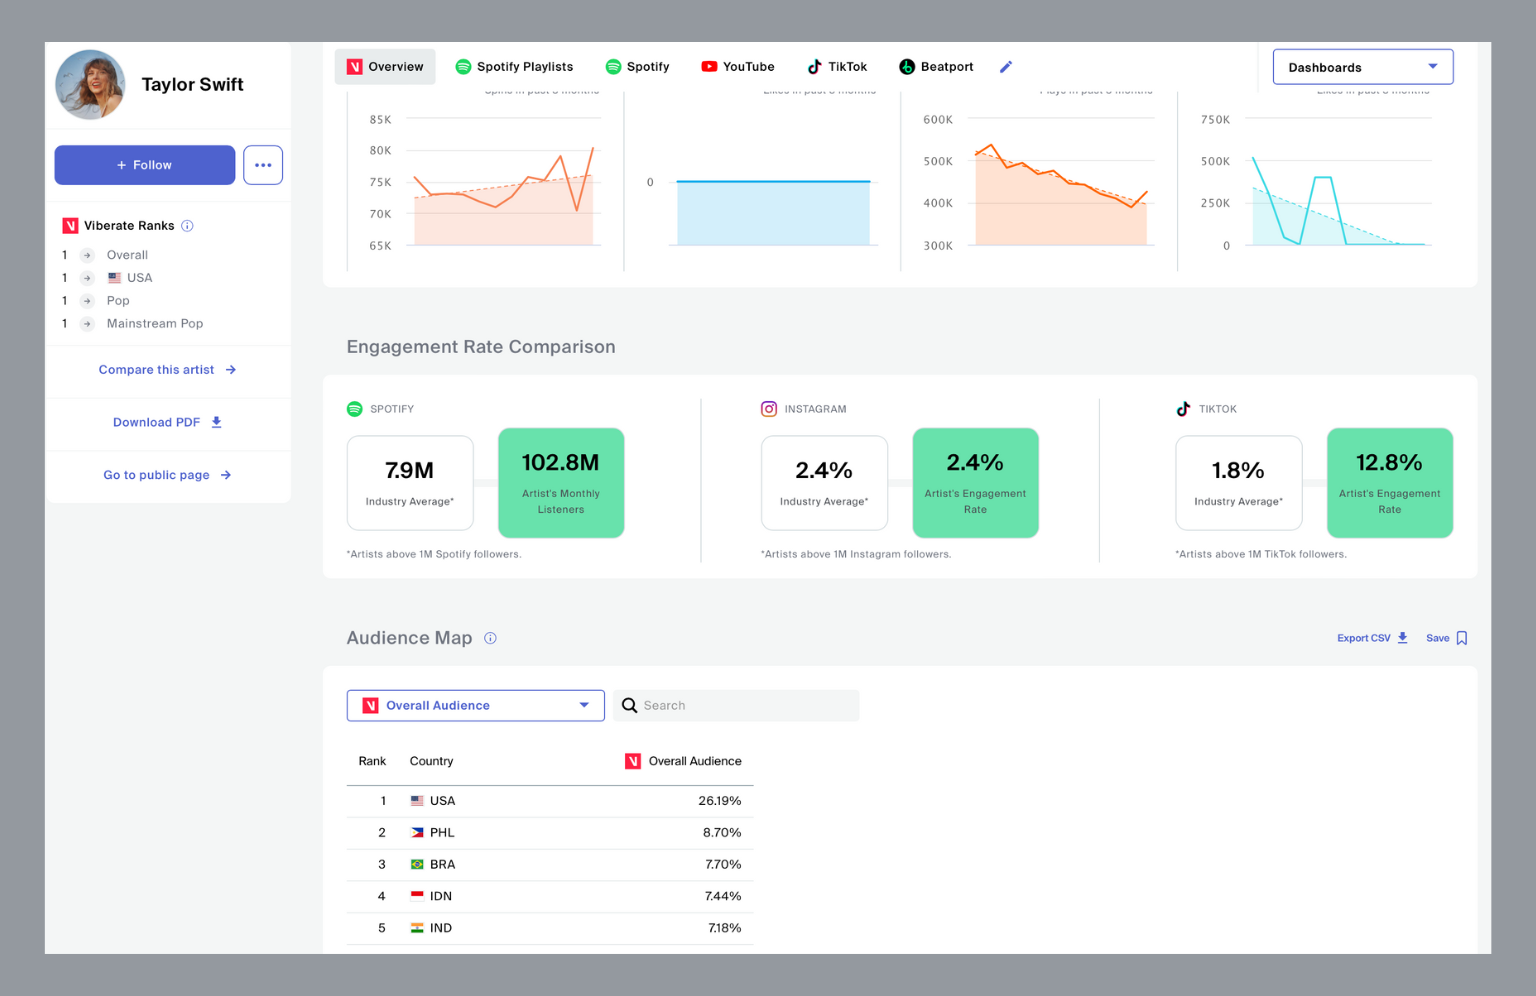
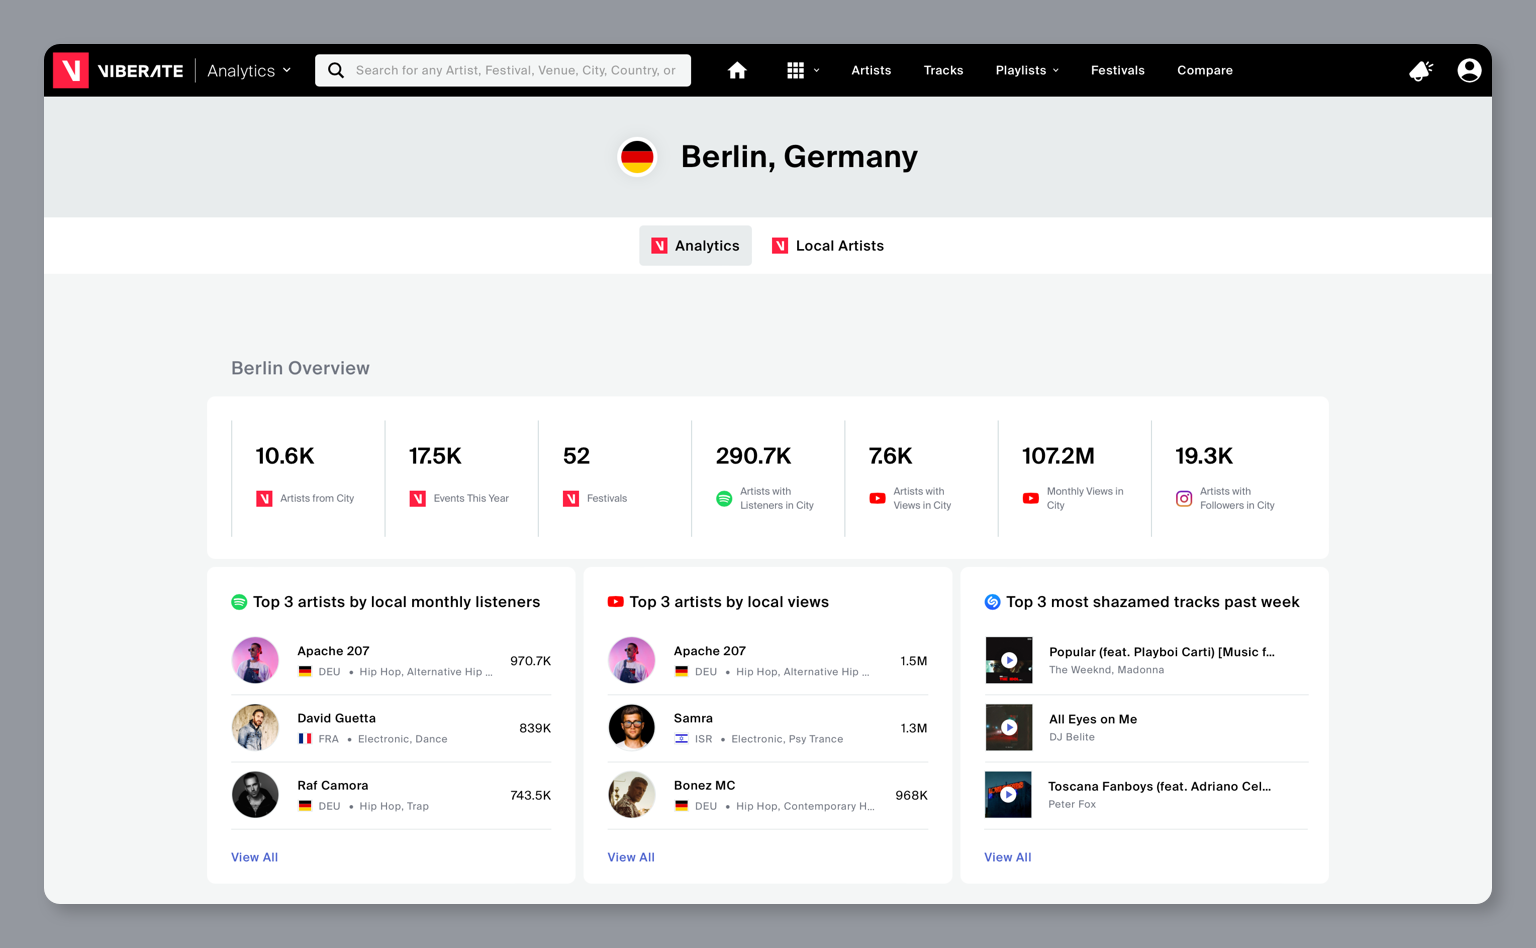
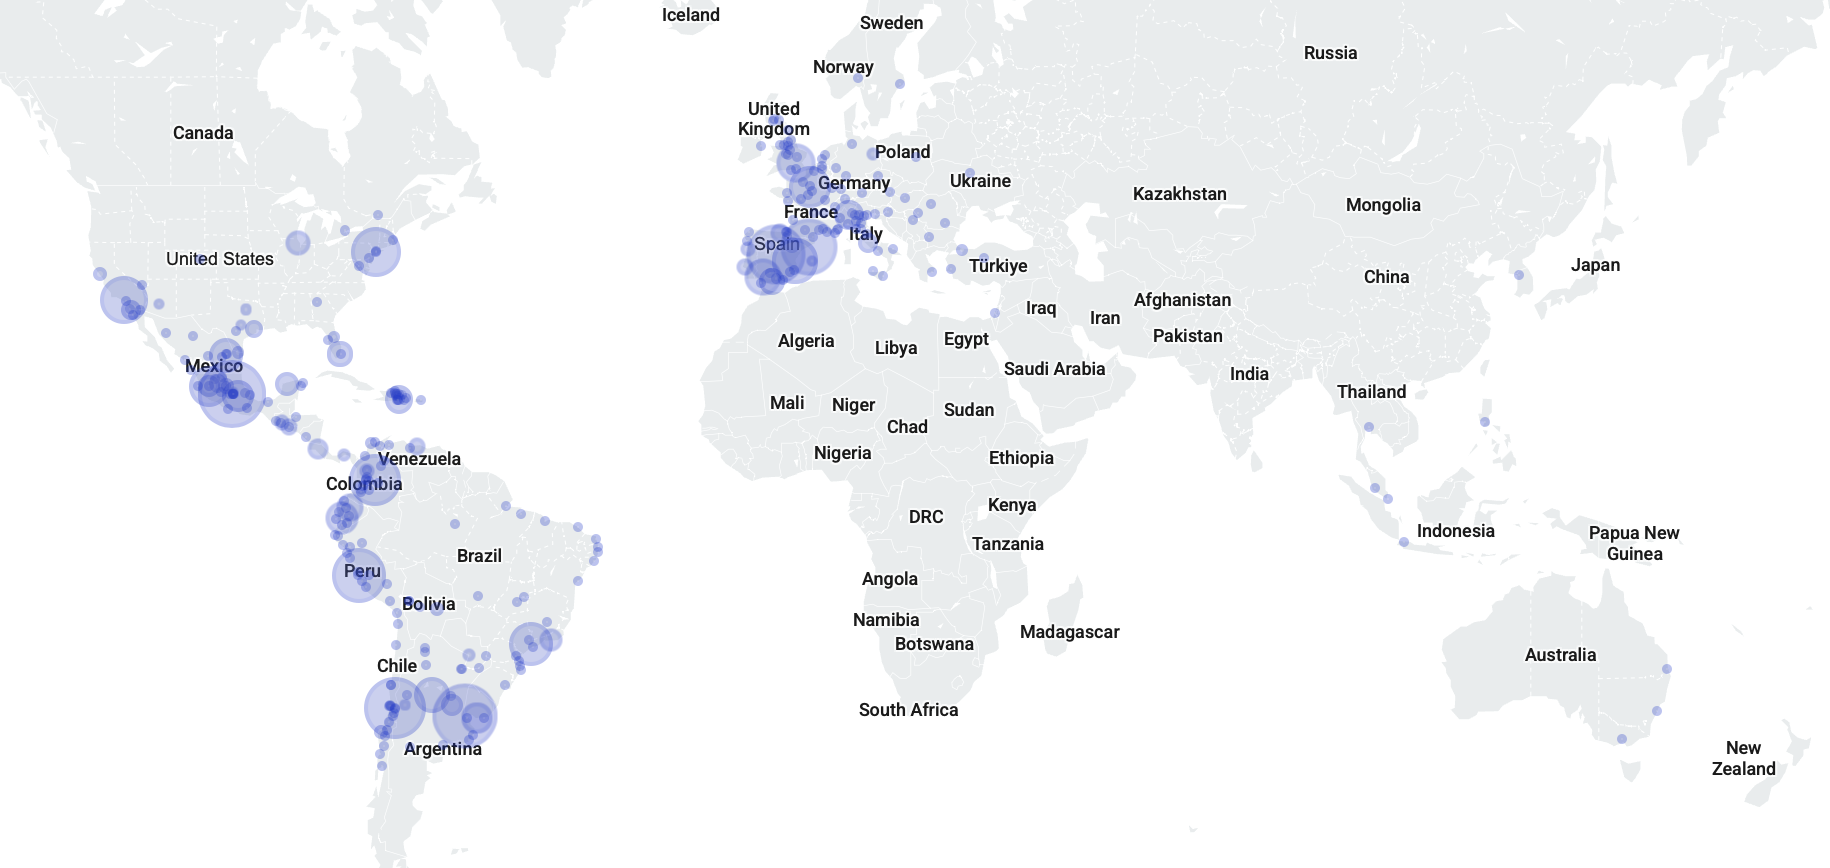
✅ 100+ cities per artist, giving you a much deeper view of where fans really are
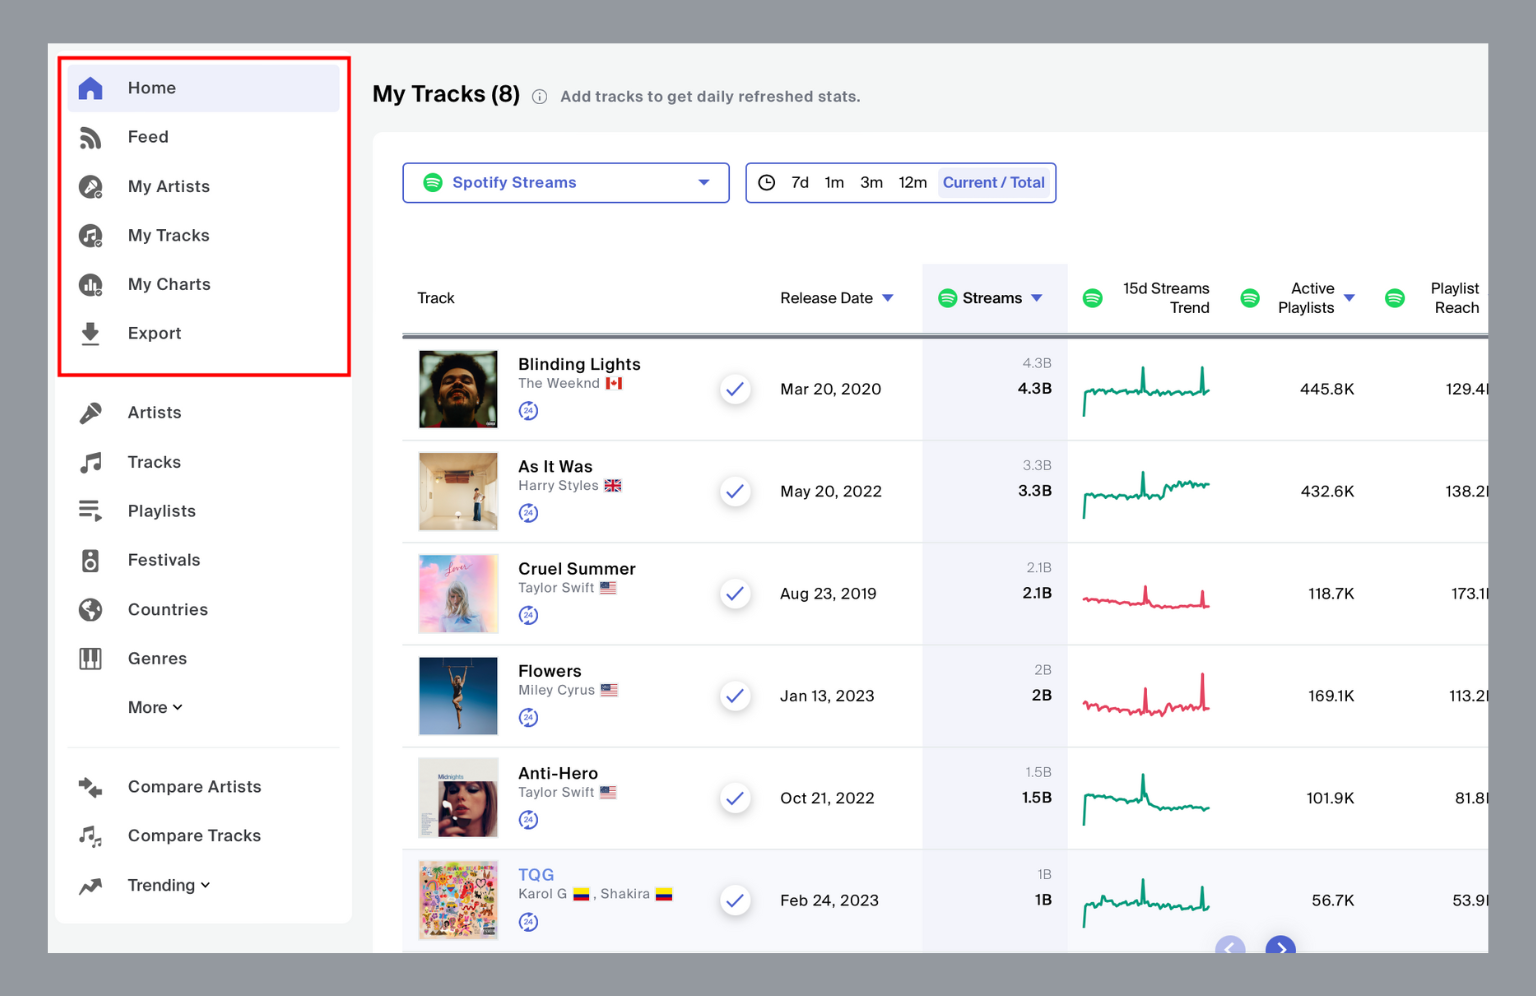
Whether you’re planning tours, running campaigns, or scouting talent, you can now rely on richer, more detailed audience insights than ever before.
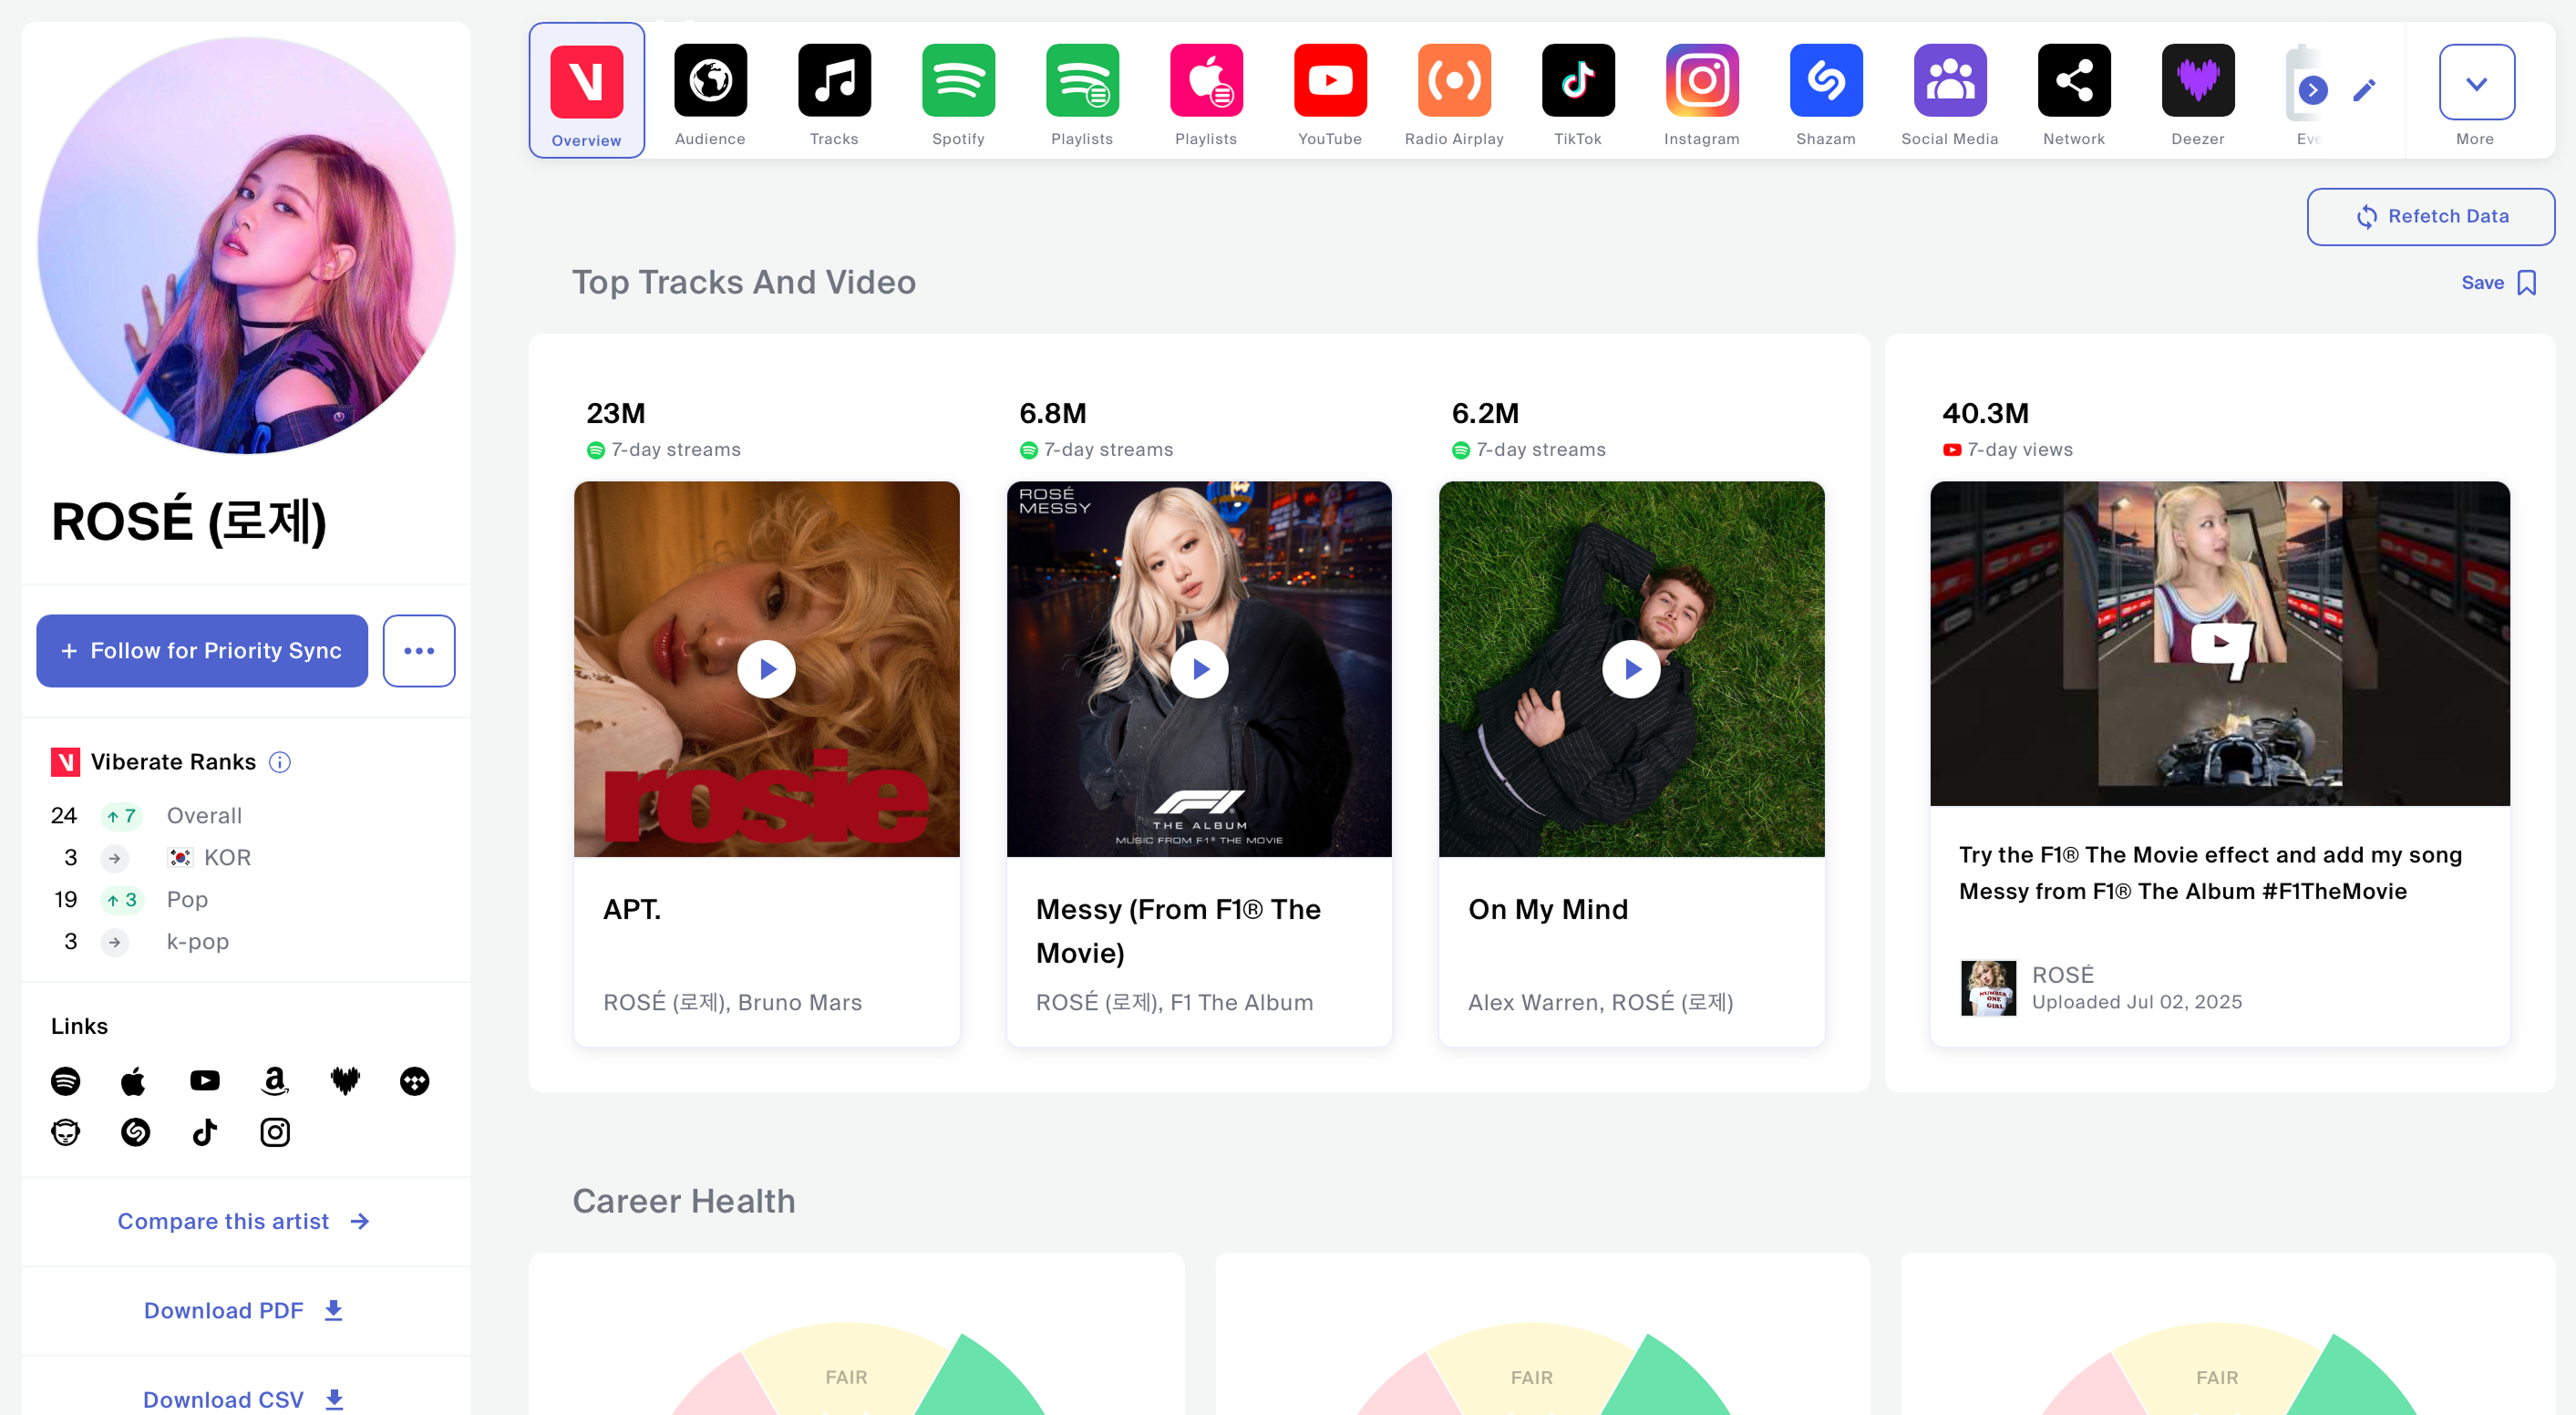
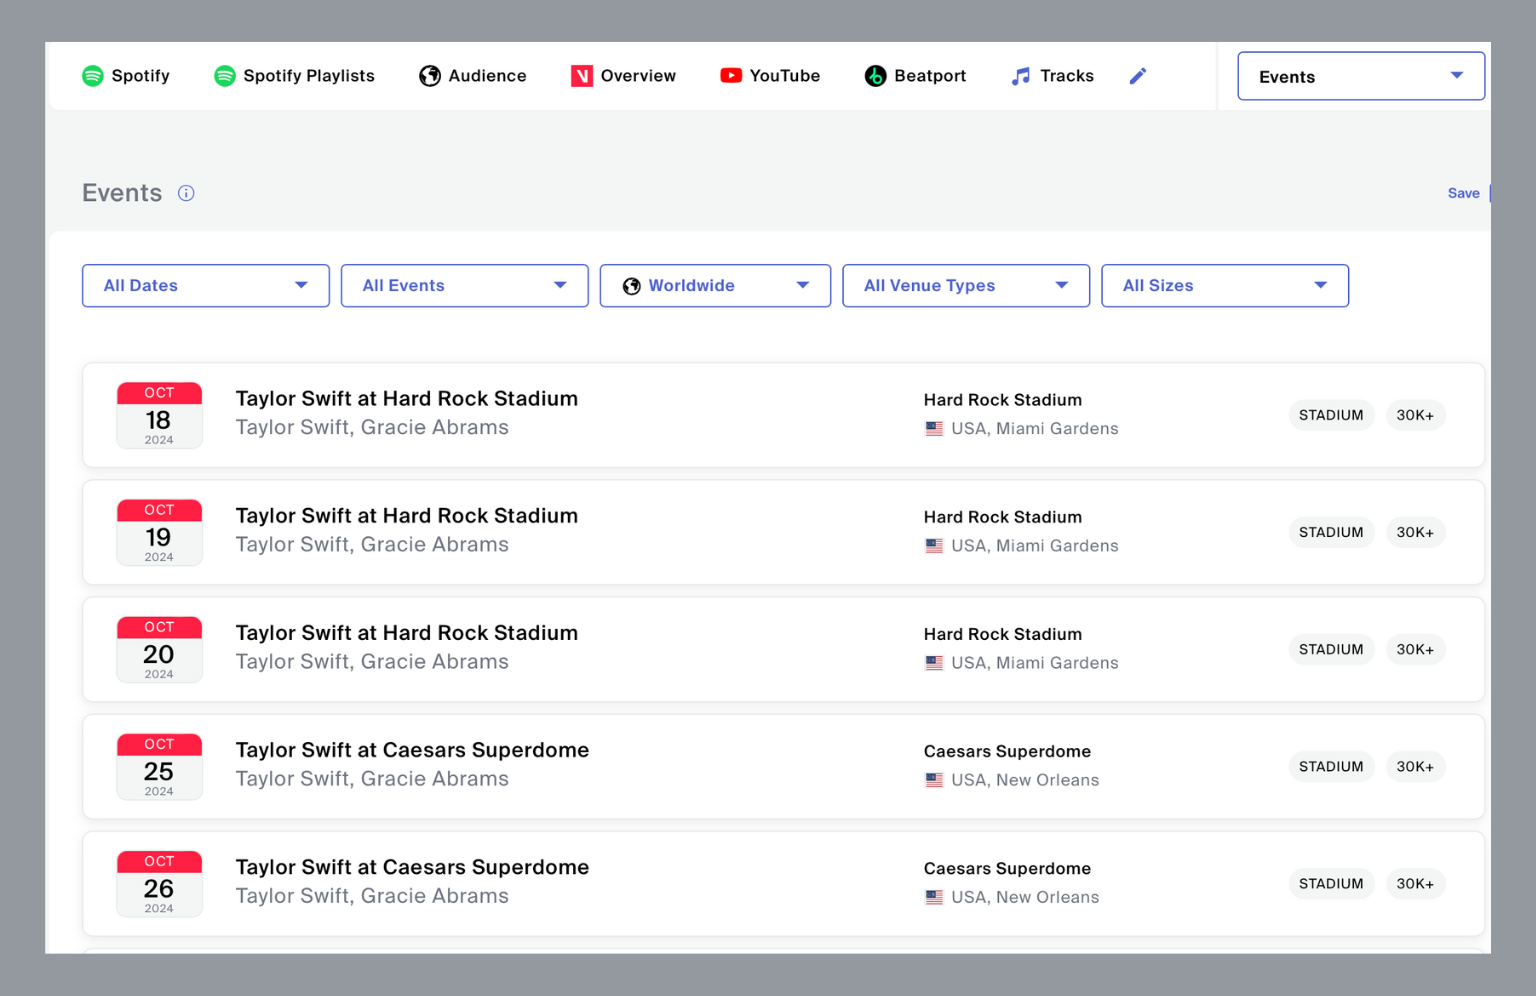
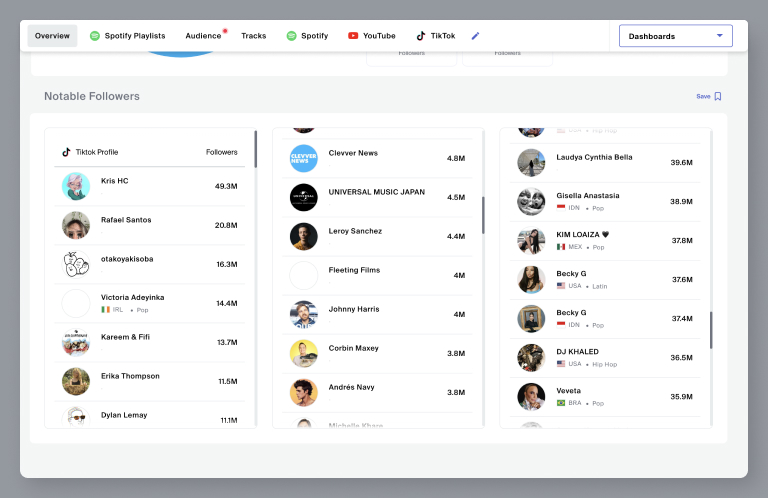
👉 Explore every artist’s audience in the Audience tab on their page