Kristian Gorenc Z
Feb 16, 2026

Each year, the BRIT Awards act as a barometer for how British music connects with audiences at home and internationally. Beyond trophies and televised performances, the shortlist reflects months of listener behavior across streaming platforms, video services, and radio. As the 2026 ceremony approaches, the nominations bring together established names, recent breakouts, and songs that have driven conversation throughout the eligibility period.
📌 Viberate Analytics: Professional music analytics suite at an unbeatable price: $19.90/mo. Charts, talent discovery tools, plus Spotify, TikTok, and other channel-specific analytics of every artist out there.
Alongside critical reception and cultural impact, awards season now unfolds in parallel with a large volume of measurable audience data. Streaming trends, video consumption, and broadcast exposure offer additional context for understanding how nominated artists and tracks performed in the months leading up to the BRITs.
This article examines performance patterns among nominees in two major BRIT Awards 2026 categories—Artist of the Year and Song of the Year—using music analytics to compare audience reach, growth, and late-period momentum. The analysis does not aim to predict voting outcomes or assess artistic merit. Instead, it provides a data-led snapshot of how audiences engaged with the nominated artists and songs during the awards cycle.
To ensure comparability, all nominees were evaluated using the same datasets, platforms, and timeframes. Only sources with consistent coverage across every nominee were included, and all metrics were assessed within clearly defined windows. This approach avoids favoring artists with longer catalogs or songs released earlier in the year.
For Artist of the Year, performance was assessed across three platforms: Spotify, YouTube, and radio airplay. Together, these sources capture on-demand listening, video engagement, and broadcast reach. TikTok data was reviewed but excluded from normalized comparisons because it was not consistently available for all nominees.
The eligibility cutoff was defined as the latest complete month available at the time of analysis, January 2026. Artist performance was measured over a rolling 12-month period from February 2025 through January 2026 to reflect sustained reach, alongside a focused 30-day window in January to capture late momentum heading into awards season.
For Song of the Year, shorter timeframes were used to reflect the faster life cycle of individual tracks. Daily Spotify data over the final 30 days was used to assess short-term momentum, while a 70-day overlapping window provided a view of sustained performance that was available for all nominated songs. Lifetime totals from Spotify, YouTube, and Shazam were used as contextual indicators of scale but were not allowed to outweigh recent trends.
Across both categories, all metrics were compared only within the nominee groups. Results were expressed in relative terms rather than precise scores, emphasizing comparative standing while avoiding false precision.
The Artist of the Year shortlist included Olivia Dean, Dave, PinkPantheress, Fred again.., Lily Allen, Lola Young, Sam Fender, JADE, Little Simz, and Self Esteem. Each artist’s performance was evaluated through a combination of streaming scale, audience growth, and cross-platform presence.
Spotify provided the clearest picture of listening behavior over the year. Across the 12-month window, Olivia Dean recorded the highest total streaming volume among the nominees, indicating sustained listener engagement throughout the eligibility period. Lola Young and PinkPantheress followed, each maintaining strong cumulative totals that reflected consistent demand.
The final month of the period highlighted differences in momentum. In January 2026, Olivia Dean again led the group in Spotify streaming volume. PinkPantheress and Dave showed the strongest listener growth during the same window, suggesting accelerating interest as the awards season approached. By contrast, several artists with larger back catalogs, including Lily Allen and Sam Fender, showed steadier or flattening listener trends during the final month.
YouTube data largely mirrored these patterns while adding another dimension to audience behavior. Olivia Dean recorded the highest total video views over the 12-month period and also led the group in January views and subscriber growth. PinkPantheress and Dave ranked close behind, reflecting strong engagement beyond audio streaming. Artists with more established audiences tended to show stable subscriber counts rather than sharp increases.
Radio airplay offered a different perspective on reach. Lola Young accumulated the highest number of radio spins over the 12-month window, pointing to strong broadcast support. Olivia Dean ranked second in overall radio scale but stood out in January by recording the highest number of spins during the month and the largest increase compared with December. This late-period acceleration set her apart from other high-rotation artists whose airplay eased toward the end of the year.
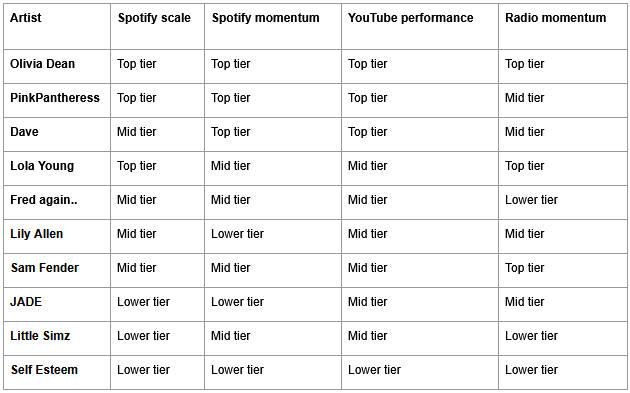
Taken together, the data showed one artist consistently appearing near the top across platforms. Olivia Dean ranked in the top tier for Spotify scale and momentum, led YouTube in both reach and growth, and posted the strongest late-period radio gains. While other nominees led individual metrics, none combined sustained reach and end-of-period momentum as consistently.
Based on these combined signals, Olivia Dean emerged as the strongest overall performer in the Artist of the Year analysis. This finding reflects relative audience engagement during the eligibility window and does not imply any assessment of artistic quality or voting outcomes.
To summarize how the leading signals compared across the nominee group, the table below shows relative performance tiers derived from the analysis. Rankings are expressed in relative terms rather than exact figures.
The Song of the Year analysis covered twelve nominated tracks, including “Man I Need,” “WHERE IS MY HUSBAND!,” “Messy,” “The Days – NOTION Remix,” “Rein Me In,” “Victory Lap,” “Blessings,” “Azizam,” “Nice To Meet You,” “Survive,” “Defying Gravity,” and “Family Matters.” Because individual songs often rise and fall more quickly than artists, the analysis focused on recent performance rather than long-term accumulation alone.
Daily Spotify streaming data provided the primary indicator of momentum. Over the final 30 days of available data, “Man I Need” recorded the highest streaming total among all nominees. “WHERE IS MY HUSBAND!” followed closely, while “Messy” remained in the top tier despite trailing the top two in daily volume. Several tracks posted lower totals but showed notable late growth, including “Rein Me In,” which recorded the fastest increase within the window.
The 70-day overlapping window offered additional insight into sustained performance. “Man I Need” again led the group in total streams over this period, followed by “WHERE IS MY HUSBAND!,” with both tracks maintaining positive growth trends. “Messy” and “The Days – NOTION Remix” followed, showing strong cumulative performance even as their growth curves softened toward the end of the window.
Lifetime scale metrics added context without overriding recent trends. “Messy” ranked first in total Spotify streams, YouTube views, and Shazam activity, reflecting broad exposure across platforms. “Man I Need” ranked second in lifetime Spotify streams and led the group in playlist reach, indicating strong support from both curated and algorithmic playlists. “WHERE IS MY HUSBAND!” also placed near the top across multiple scale indicators.
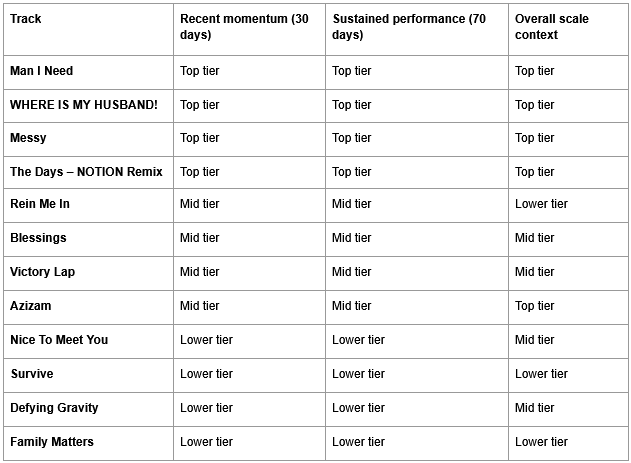
When recent momentum and broader scale were considered together, “Man I Need” stood out for combining the strongest current streaming performance with top-tier playlist exposure and competitive lifetime totals. While other tracks led individual measures, “Man I Need” aligned most closely with the indicators tied to current audience behavior.
As a result, “Man I Need” was identified as the strongest overall performer in the Song of the Year analysis. This conclusion reflects relative engagement patterns during the analysis period and does not represent a prediction or endorsement beyond the data.
The table below summarizes how the leading tracks compared across recent momentum, sustained performance, and broader scale context.
Awards season often centers on debate and interpretation, but data provides a way to ground those discussions in observable audience behavior. Music analytics helps clarify how listeners engaged with artists and songs across platforms, highlighting where attention was building, stabilizing, or declining at key moments.
By applying consistent methodology and transparent comparisons, this analysis adds context to the BRIT Awards 2026 nominations without replacing critical or cultural perspectives. It illustrates how different forms of reach—streaming, video, and broadcast—intersect, and how late-period momentum can differ from long-term popularity.
As digital platforms continue to shape how music is consumed and measured, data-driven context is likely to play a growing role in how awards seasons are discussed. Used carefully, music analytics offers readers a clearer view of how nominated artists and songs connected with audiences during the period that mattered most.
Source of music data: Viberate.com
11M+ artists, 100M+ songs, 19M+ playlists, 6K+ festivals and 100K+ labels on one platform, built for industry professionals.