Matic Magister
Jul 24, 2026

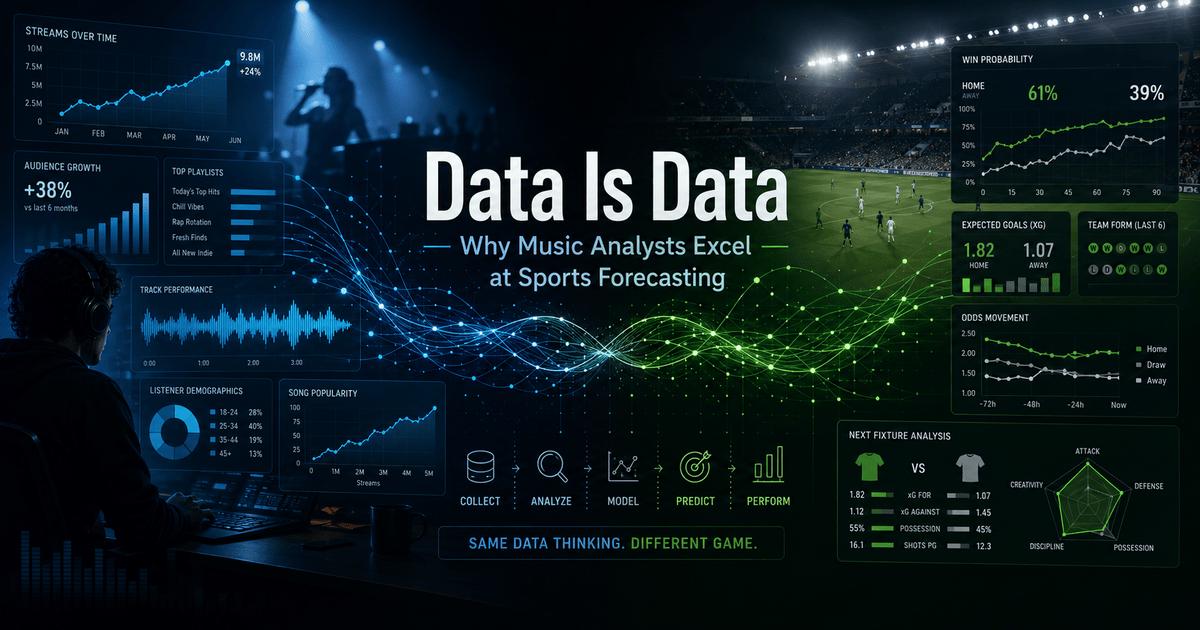

Data Is Data: Why Music Analysts Excel at Sports Forecasting
Ask an A&R scout how they knew an artist was about to break and you'll rarely hear anything mystical. They saw the playlist adds stack up in the right order. They noticed retention holding steady while reach exploded, which is the opposite of how a fad decays. They compared the growth curve against a hundred artists they'd tracked before, and it rhymed with the good ones.
Now ask a sports forecaster how they called an upset. Different vocabulary, same answer. Form curves instead of streaming velocity, efficiency ratings instead of listener retention, and underneath it the identical discipline of trusting the numbers over the noise. Both jobs come down to spotting momentum before it's consensus, then having the nerve to act on it while the rest of the room is still debating the vibes. That's the case this piece wants to make: the cognitive habits music analysts build staring at dashboards are, with almost no modification, the ones that make somebody good at reading a weekend fixture list.
The Mechanics of Momentum: Charts vs. Odds
The modern music business runs on an enormous behavioral dataset. IFPI puts recorded music at $31.7 billion, eleven straight years of growth, with 837 million paid streaming subscribers generating signals around the clock. Anyone working inside that, whether in A&R, management or label marketing, processes more momentum data in a quarter than the gatekeepers of the CD era saw in a career. Analytics now shapes signing and marketing decisions; one side effect is a workforce that can no longer look at any numbers casually.
Which is why sports data feels familiar the first time a music analyst opens it. Transitioning from playlist tracking to point spreads used to require expensive, enterprise-level advisory networks, but modern data democratization has made deep market data highly accessible. By utilizing a specialized free sports analytics dashboard, data heads can map out live matchday trends, market movements, and algorithmic player performance projections without financial barriers. The adjustment period is mostly vocabulary - an afternoon, maybe two - because the underlying logic remains identical. Playlist velocity behaves exactly like home form: streaks are real, they decay, and the job is catching the decay early.
Listener retention is a fundamentals check, and so are a team's underlying efficiency numbers; both exist to tell you when the flashy top-line figure is lying. Comparing two artists side by side before a signing decision, growth trajectory against growth trajectory with the demographics underneath, is structurally the same exercise as weighing two teams' recent schedules to decide whose form is real. Even release scheduling maps across. Dropping a single into a crowded Friday is a version of the squad rotation question, namely when your assets face the least resistance.
De-Siloing Your Data Habits
There's also a case for sports tracking as deliberate practice rather than a guilty distraction. Studio-side work never quite lets you test your own judgment. Campaigns have too many hands on them, results arrive slowly, and every outcome gets argued about in the postmortem until nobody remembers what the original call was. A fixture list is a cleaner lab. You make a read, the weekend grades it, and nobody can claim the goal was actually a branding decision. For people who spend their working lives waiting months to find out whether they were right, that immediacy is half the appeal.
Treated with a little structure, the hobby compounds. Log your reads. Review the misses the way you'd autopsy an underperforming release. The aim isn't to turn a pastime into an income stream, and it shouldn't be. The aim is calibration, finding out how good your judgment really is when the dataset can't be massaged for a quarterly deck. Plenty of analysts discover their process is better than they assumed and their confidence is worse. Both discoveries travel back to the day job.
There's a quieter professional payoff too. Reading an unfamiliar dataset cold, deciding which metrics matter and which are decoration, is a skill that atrophies when you only ever look at one industry's numbers. Analysts who cross-train on a second domain tend to come back sharper on their first, and sports happens to be the most available, most legible second domain going.
Same Story, Different Numbers
Music analysts spent a decade learning to hear what a growth curve was saying before the rest of the industry believed it was worth listening to. Sports numbers speak the same language with a different accent. The dashboards were never the skill; the reading was.
Source of music data: Viberate.com
-
📌 Viberate - Music Intelligence is the data & AI layer behind music analytics, connecting artist discovery, audiences, playlists, tracks, Spotify, TikTok, YouTube, streaming, and radio airplay.
 Next article
 Previous article
11M+ artists, 100M+ songs, 12M+ playlists, 6K+ festivals and 100K+ labels on one platform, built for industry professionals.