Vasja Veber
Sep 30, 2026

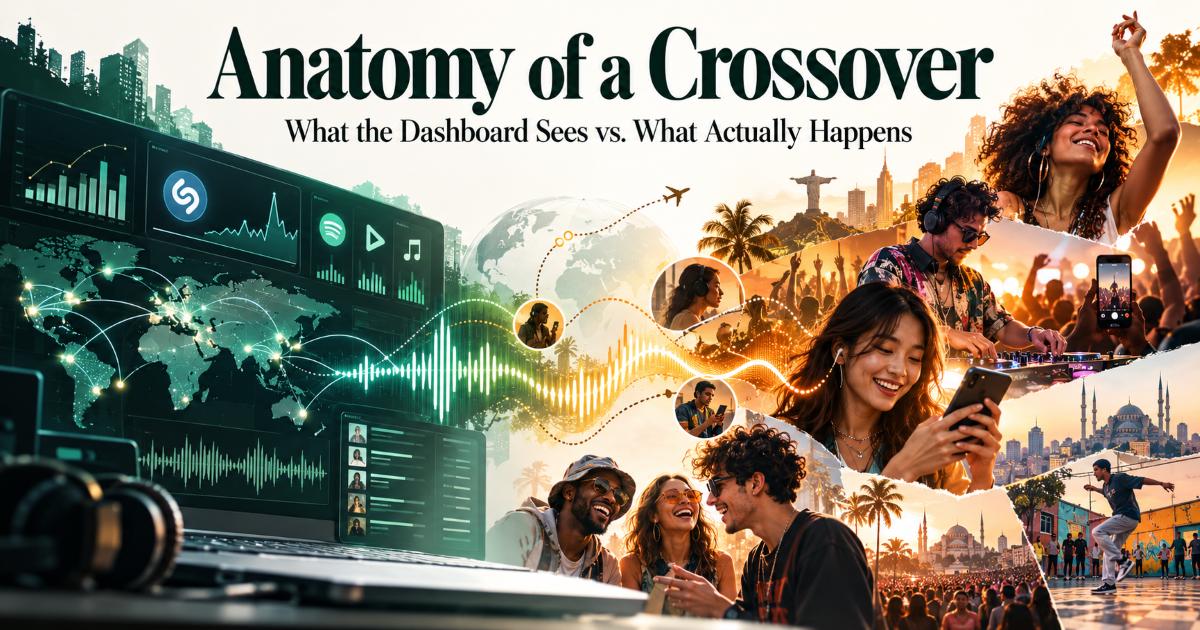

Spotify counted more than 240 million first-time Afrobeats discoveries worldwide in 2025, with Latin American streams of the genre up over 400% since 2020. Every one of those discoveries has a chain of events behind it, and almost none of that chain is visible in any analytics product.
What follows is the shape those eight to twelve weeks usually take — a composite, not one specific record, assembled from the pattern that repeats across genre crossovers. Left column: what your dashboard registers. Right column: what is actually going on.
Dashboard: flat. Regional streams, no foreign markets, nothing worth an alert.
Reality: a track is circulating inside its home scene. Producers hear it. A few hundred people have it saved. The information exists, it is simply nowhere a platform can index.
Dashboard: a handful of saves from an unexpected country. Statistically indistinguishable from noise, and correctly ignored by every alerting system ever built.
Reality: this is the actual crossover event, and it almost always has a named cause. Somebody moved. Somebody visited. Somebody was talking to a person in another country about music and played them something. This is the moment worth finding, and it is the moment no tool will ever surface.
Dashboard: Shazam activity in the new market rises faster than streaming. The gap looks like a data error.
Reality: the gap is the most diagnostic signal on the whole timeline. People are hearing the track socially — in a room, at a party, on a call — before they know what it is called. Streaming lags because identification comes first. A wide Shazam-to-stream gap is a fingerprint of human transmission; a narrow one points at playlist placement.
Dashboard: the track enters algorithmic playlists in the new market. Streams climb sharply. Someone screenshots the graph.
Reality: the recommender has found a foothold that already existed and is now amplifying it. Recommendation systems are very good at this part and structurally incapable of the earlier part — they work by finding listeners similar to existing listeners, which requires existing listeners to find first.
Dashboard: the playlist gets credit. Reporting says discovery came from editorial or algorithmic placement.
Reality: the playlist was step four. Steps one through three were a person, a conversation and a Shazam, none of which produced a row in any table.
Diaspora corridors still carry most of it: Lagos to London, Kingston to Toronto, Manila to the Gulf. Touring does some. Discord servers and music forums do a surprising amount.
A newer share happens in live conversation between people who have never met. Someone on a random video chat platform, matched with a person in another country over a shared interest, ends up playing them something — which transmits what a playlist thumbnail cannot, namely another human being's face while a song they love is on. Small volume against global streaming. Disproportionate influence at week 2, which is the week that decides everything downstream.
One caveat worth stating plainly: none of this is an argument against the dashboard. Attribution at scale is the only way to run a release, and the platforms that produce it have made artist development legible in ways the industry spent decades guessing at. The argument is narrower — that the earliest and most decisive part of a crossover happens below the instrumentation, and knowing that changes where you look.
Lower your anomaly threshold for foreign markets specifically. The signal you want is buried under the noise floor of every default dashboard setting, and the whole advantage is in catching it at week 2, when it still means something.
Keep a manual list of accounts that sit upstream of your genre — the two YouTubers whose reactions precede chart movement, the Discord moderators, the regional DJs whose sets predict next quarter. Nobody sells that as a data product because it has to be built by hand, which is exactly why it still has edge.
And when a track breaks somewhere unexpected, go find the human. Someone knows who played it to whom. That answer is worth more than the chart position it produced, because it tells you where to look next time.
The 240 million figure is real. It is also the receipt for a few hundred thousand conversations nobody logged.
Source of music data: Viberate.com
-
📌 Viberate - Music Intelligence is the data & AI layer behind music analytics, connecting artist discovery, audiences, playlists, tracks, Spotify, TikTok, YouTube, streaming, and radio airplay.
 Next article
 Previous article
11M+ artists, 100M+ songs, 12M+ playlists, 6K+ festivals and 100K+ labels on one platform, built for industry professionals.