Kristian Gorenc Z
Oct 22, 2026

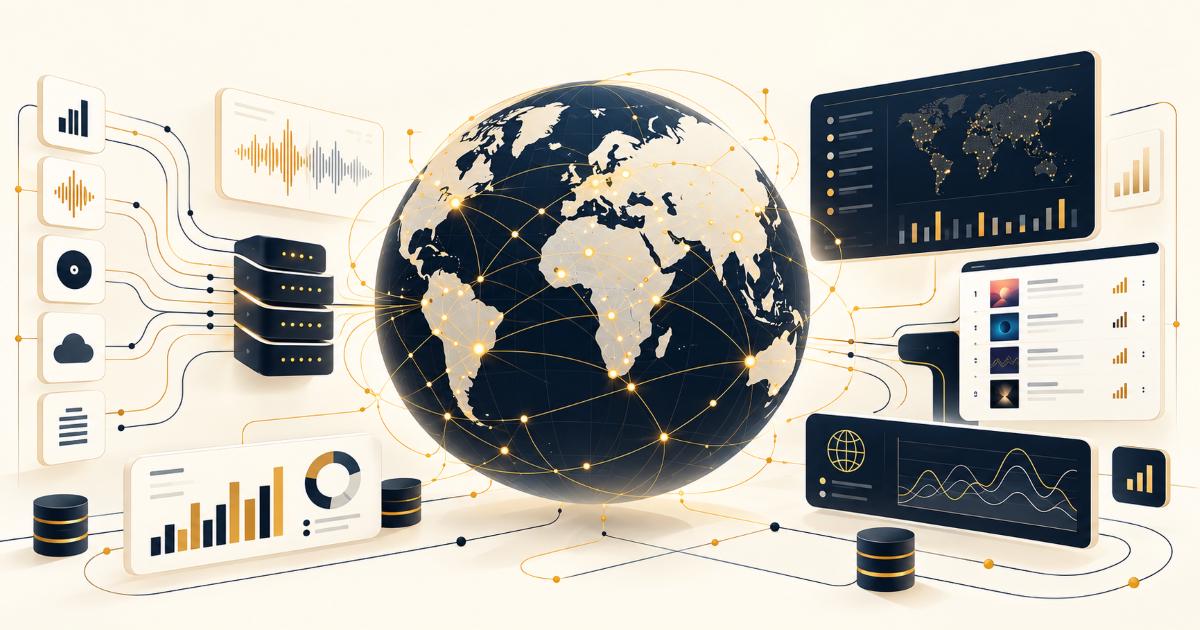

Music data infrastructure is the set of tools and processes that lets analysts pull public stats from streaming services, charts, radio and social apps, then clean and store them in one place. It covers official APIs, chart feeds, data pipelines, databases, and the ID codes that match one song across every platform.
When you see a song's global rank or an artist's listener count by country, someone built a system to gather that number. Doing it for one market is simple. Doing it for more than 100 countries, every day, is a real engineering job.
This guide walks through where the data comes from, how it is collected, what makes global tracking hard, and how teams keep the numbers honest.
Public music data is anything a platform shows openly to any visitor or developer. Think play counts on a track, monthly listeners on an artist page, YouTube views, follower totals and chart positions. Since these numbers often differ by country, analysts check them through proxy networks such as Oxylabs, a well-known provider of proxy servers in many locations. Teams looking for different pricing or wider country coverage also review to find the right fit for their regional checks.
It also includes discovery signals. Playlist adds, Shazam chart entries and the number of TikTok videos using a sound all tell analysts where a song is gaining ground. Together, these make up most of what people mean by music analytics.
Public data has clear limits. It does not include royalty payments, label contracts, or details about individual listeners. Those stay private between platforms, rights holders and users.
Global music data comes from four groups of sources, and each one shows a different side of how a song performs. Results also vary by market, so the same track can rank high in one country and barely appear in another. To see local results the way listeners do, analysts use proxy services that offer residential, mobile and datacenter IP addresses in 195+ countries, with city-level targeting. One such provider is , which lets analysts route their checks through specific countries before the data goes into a report.
No single source tells the full story. A track can top TikTok in Brazil while barely moving on radio. That is why analysts track alongside Spotify, social apps and local services, rather than relying on one platform.
In-article image suggestion: an infographic map showing which streaming service leads in each major region. ALT text: "Map of leading music streaming platforms by region."
Analysts usually combine three methods.
Official APIs and partner feeds. An API lets software request data directly from a platform in a clean format. Spotify, Apple Music and YouTube all offer developer access, and many teams start with because it covers tracks, artists and playlists. Access rules can change, though. On November 27, 2024, Spotify limited several Web API endpoints for new apps, including Related Artists and Audio Features.
Daily chart collection. Most platforms publish daily or weekly charts per country. Scheduled jobs save each one at that market's update time, building a history.
Public page collection. Some numbers appear only on public web pages. Teams collect these carefully, at a gentle pace, and within each site's terms.
A music data system moves numbers through four stages, from raw source to readable dashboard.
Collection pipeline. Scheduled jobs pull data from APIs, chart files and public pages, then pass it along.
Storage. Raw and cleaned data sit in a cloud database or data warehouse, so years of history stay searchable.
Matching and cleanup. The system makes sure the same song is counted as one song on every platform.
Dashboards. Charts and tables turn millions of rows into answers people can act on.
Step three is where most of the hard work happens. The International Standard Recording Code (ISRC) is a 12-character ID given to each specific recording, managed by IFPI. Because the same ISRC travels with a recording to Spotify, Apple Music and YouTube, analysts use it to merge stats across platforms. A related code, the ISWC, identifies the underlying composition rather than a specific recording.
Matching also helps with artist names. Two artists can share a name, and one artist can appear under spellings in different scripts. Good systems keep a single verified profile for each artist, which is a key point when comparing .
In-article image suggestion: a simple flow diagram of the four stages above. ALT text: "Four-stage music data pipeline from collection to dashboard."
Tracking music across 100+ countries is hard because every market works a little differently. The main problems fall into five areas.
Different platforms lead in different places. Spotify may dominate one country while JioSaavn, Melon or Boomplay leads another. Skip the local leader and your picture of that market is wrong.
Regional views. Some pages show different charts and stats depending on the visitor's country. To see a local chart the way a listener in Seoul or Lagos sees it, teams use servers based in that country.
Request limits. Platforms cap how many requests a single app can make in a set time. Spreading checks across the day and keeping volumes modest helps collection jobs stay within those caps.
Language and script differences. Song titles and artist names appear in Hindi, Korean, Arabic, Cyrillic and many other scripts. Systems must store and match these correctly, or one song turns into three.
Missing local data. Some smaller markets have no official chart or publish data late. Analysts mark these gaps clearly instead of filling them with guesses.
Accurate music data depends on checking every number against more than one signal. A sudden jump in streams means little on its own. It becomes believable when Shazam searches, social mentions and playlist adds rise at the same time.
The same habit helps catch fake activity. Artificial streams from bots or click farms often show odd patterns: huge plays from one small region, listeners who never save the track, or growth with no social buzz behind it. Analysts flag these spikes and review them before they reach a report.
Delayed feeds are the other common issue. When a platform skips a day, good systems label the gap and backfill it once the data arrives.
Record labels and A&R teams use country-level stats to spot rising artists early. A song climbing in Mexico and Colombia before it reaches the US is a strong signal worth acting on.
Artist managers use the same data to plan tours and target ads. If an artist's listeners cluster in a few cities, those cities make sense for shows. Independent musicians benefit too, and many now use to decide where to promote next.
Collecting public music stats is common, but it comes with rules. Each platform sets terms of service that explain what developers and visitors may access and how often. Reading those terms before building a collection job saves trouble later.
Privacy laws matter as well. The EU's GDPR and California's CCPA protect personal information. Music analysts work with totals such as streams, listeners and chart ranks, not data about individual people.
The tools behind collection should follow the same standard. Good practice means modest request volumes, clear records of what was collected, and respect for each platform's rules.
Every global music stat you see rests on a lot of quiet work. Data has to be collected on time, matched across platforms, checked for fakes and stored safely. When that system works, labels, artists and marketers can trust what the numbers say.
The core pieces stay the same whatever the scale. Start with official APIs and chart feeds, use ISRC codes to match recordings, cover the local platforms that lead each market, and cross-check every spike before reporting it. Add clear rules for privacy and platform terms, and the system can grow from a handful of countries to more than 100 without losing accuracy.
Source of music data: Viberate.com
-
📌 Viberate - Music Intelligence is the data & AI layer behind music analytics, connecting artist discovery, audiences, playlists, tracks, Spotify, TikTok, YouTube, streaming, and radio airplay.
 Next article
 Previous article

11M+ artists, 100M+ songs, 12M+ playlists, 6K+ festivals and 100K+ labels on one platform, built for industry professionals.